|
Download Data (XLS File) |
|
|||||
|
|||||
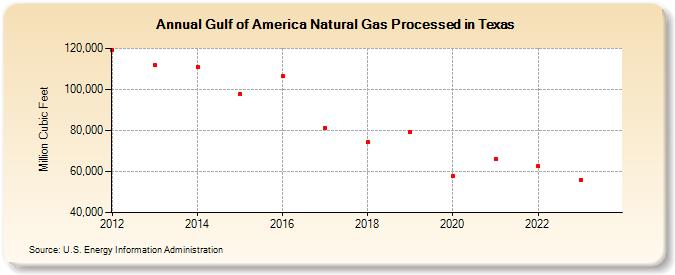
| Gulf of America Natural Gas Processed in Texas (Million Cubic Feet) | |||||
| Decade | Year-0 | Year-1 | Year-2 | Year-3 | Year-4 | Year-5 | Year-6 | Year-7 | Year-8 | Year-9 |
|---|---|---|---|---|---|---|---|---|---|---|
| 2010's | 119,456 | 111,949 | 111,147 | 97,666 | 106,501 | 81,441 | 74,175 | 79,235 | ||
| 2020's | 57,810 | 66,193 | 62,583 | 55,934 | 60,531 |
| - = No Data Reported; -- = Not Applicable; NA = Not Available; W = Withheld to avoid disclosure of individual company data. |
| Release Date: 5/29/2026 |
| Next Release Date: 6/30/2026 |
Referring Pages: