|
Download Data (XLS File) |
|
|||||
|
|||||
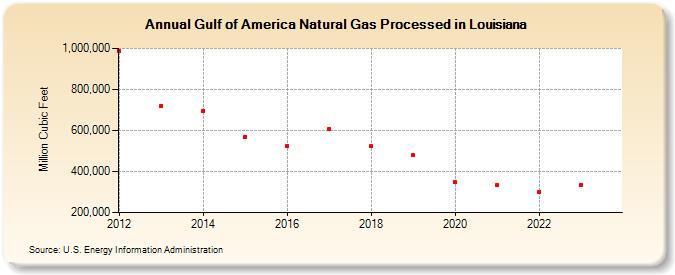
| Gulf of America Natural Gas Processed in Louisiana (Million Cubic Feet) | |||||
| Decade | Year-0 | Year-1 | Year-2 | Year-3 | Year-4 | Year-5 | Year-6 | Year-7 | Year-8 | Year-9 |
|---|---|---|---|---|---|---|---|---|---|---|
| 2010's | 988,219 | 719,435 | 696,242 | 569,833 | 525,350 | 609,017 | 524,219 | 478,401 | ||
| 2020's | 347,000 | 333,287 | 302,465 | 333,970 | 290,926 |
| - = No Data Reported; -- = Not Applicable; NA = Not Available; W = Withheld to avoid disclosure of individual company data. |
| Release Date: 6/30/2026 |
| Next Release Date: 7/31/2026 |