|
Download Data (XLS File) |
|
|||||
|
|||||
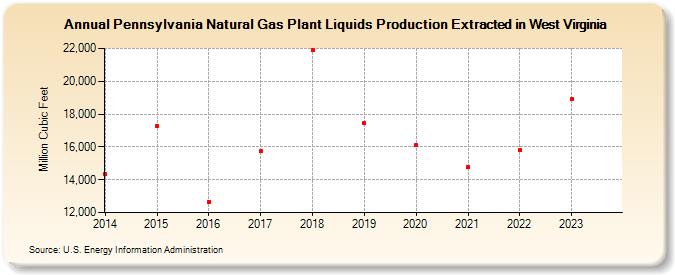
| Pennsylvania Natural Gas Plant Liquids Production Extracted in West Virginia (Million Cubic Feet) | |||||
| Decade | Year-0 | Year-1 | Year-2 | Year-3 | Year-4 | Year-5 | Year-6 | Year-7 | Year-8 | Year-9 |
|---|---|---|---|---|---|---|---|---|---|---|
| 2010's | 14,335 | 17,257 | 12,664 | 15,738 | 21,905 | 17,436 | ||||
| 2020's | 16,102 | 14,766 | 15,783 | 18,891 | 19,339 |
| - = No Data Reported; -- = Not Applicable; NA = Not Available; W = Withheld to avoid disclosure of individual company data. |
| Release Date: 5/29/2026 |
| Next Release Date: 6/30/2026 |