|
Download Data (XLS File) |
|
|||||
|
|||||
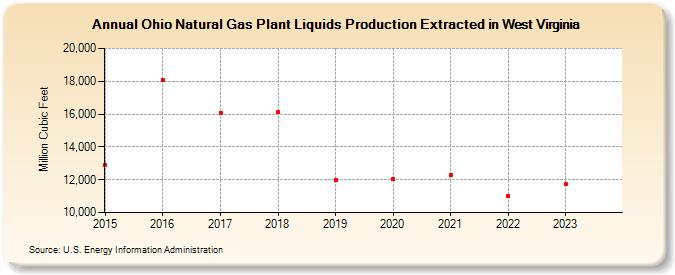
| Ohio Natural Gas Plant Liquids Production Extracted in West Virginia (Million Cubic Feet) | |||||
| Decade | Year-0 | Year-1 | Year-2 | Year-3 | Year-4 | Year-5 | Year-6 | Year-7 | Year-8 | Year-9 |
|---|---|---|---|---|---|---|---|---|---|---|
| 2010's | 12,884 | 18,091 | 16,070 | 16,107 | 11,991 | |||||
| 2020's | 12,035 | 12,281 | 10,990 | 11,723 | 12,889 |
| - = No Data Reported; -- = Not Applicable; NA = Not Available; W = Withheld to avoid disclosure of individual company data. |
| Release Date: 5/29/2026 |
| Next Release Date: 6/30/2026 |