|
Download Data (XLS File) |
|
|||||
|
|||||
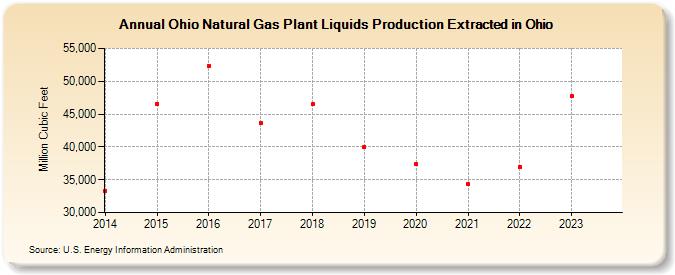
| Ohio Natural Gas Plant Liquids Production Extracted in Ohio (Million Cubic Feet) | |||||
| Decade | Year-0 | Year-1 | Year-2 | Year-3 | Year-4 | Year-5 | Year-6 | Year-7 | Year-8 | Year-9 |
|---|---|---|---|---|---|---|---|---|---|---|
| 2010's | 33,332 | 46,606 | 52,360 | 43,599 | 46,463 | 39,989 | ||||
| 2020's | 37,324 | 34,294 | 36,903 | 47,703 | 60,574 |
| - = No Data Reported; -- = Not Applicable; NA = Not Available; W = Withheld to avoid disclosure of individual company data. |
| Release Date: 6/30/2026 |
| Next Release Date: 7/31/2026 |