|
Download Data (XLS File) |
|
|||||
|
|||||
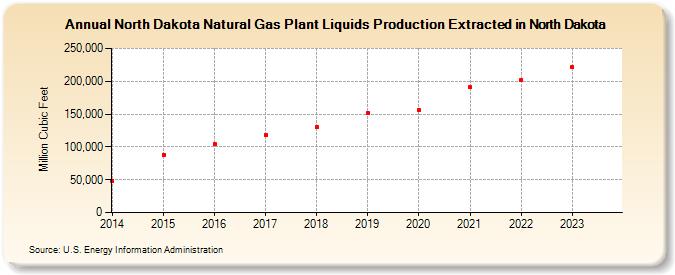
| North Dakota Natural Gas Plant Liquids Production Extracted in North Dakota (Million Cubic Feet) | |||||
| Decade | Year-0 | Year-1 | Year-2 | Year-3 | Year-4 | Year-5 | Year-6 | Year-7 | Year-8 | Year-9 |
|---|---|---|---|---|---|---|---|---|---|---|
| 2010's | 48,504 | 87,776 | 104,382 | 118,422 | 130,005 | 151,412 | ||||
| 2020's | 155,669 | 190,624 | 202,148 | 219,544 | 228,398 |
| - = No Data Reported; -- = Not Applicable; NA = Not Available; W = Withheld to avoid disclosure of individual company data. |
| Release Date: 6/30/2026 |
| Next Release Date: 7/31/2026 |