|
Download Data (XLS File) |
|
|||||
|
|||||
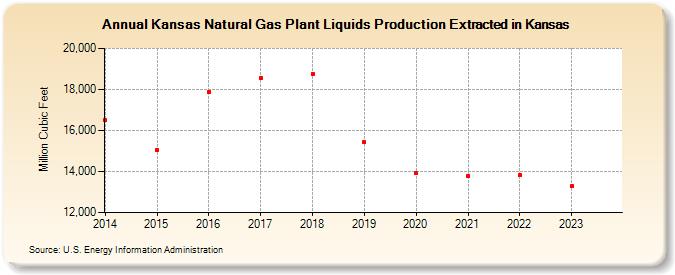
| Kansas Natural Gas Plant Liquids Production Extracted in Kansas (Million Cubic Feet) | |||||
| Decade | Year-0 | Year-1 | Year-2 | Year-3 | Year-4 | Year-5 | Year-6 | Year-7 | Year-8 | Year-9 |
|---|---|---|---|---|---|---|---|---|---|---|
| 2010's | 16,496 | 15,043 | 17,864 | 18,554 | 18,761 | 15,420 | ||||
| 2020's | 13,905 | 13,794 | 13,832 | 13,283 | 10,305 |
| - = No Data Reported; -- = Not Applicable; NA = Not Available; W = Withheld to avoid disclosure of individual company data. |
| Release Date: 5/29/2026 |
| Next Release Date: 6/30/2026 |