|
Download Data (XLS File) |
|
|||||
|
|||||
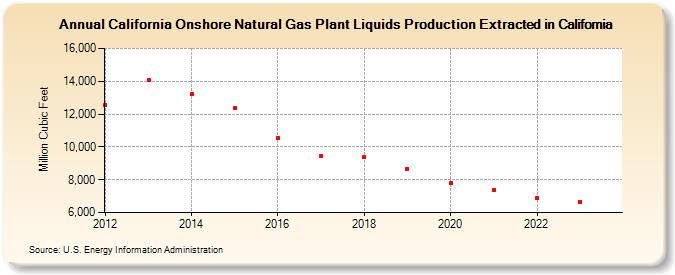
| California Onshore Natural Gas Plant Liquids Production Extracted in California (Million Cubic Feet) | |||||
| Decade | Year-0 | Year-1 | Year-2 | Year-3 | Year-4 | Year-5 | Year-6 | Year-7 | Year-8 | Year-9 |
|---|---|---|---|---|---|---|---|---|---|---|
| 2010's | 12,575 | 14,083 | 13,192 | 12,344 | 10,551 | 9,422 | 9,369 | 8,659 | ||
| 2020's | 7,773 | 7,398 | 6,861 | 6,653 | 6,007 |
| - = No Data Reported; -- = Not Applicable; NA = Not Available; W = Withheld to avoid disclosure of individual company data. |
| Release Date: 6/30/2026 |
| Next Release Date: 7/31/2026 |