|
Download Data (XLS File) |
|
|||||
|
|||||
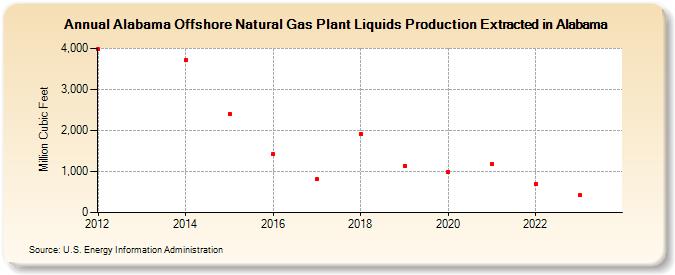
| Alabama Offshore Natural Gas Plant Liquids Production Extracted in Alabama (Million Cubic Feet) | |||||
| Decade | Year-0 | Year-1 | Year-2 | Year-3 | Year-4 | Year-5 | Year-6 | Year-7 | Year-8 | Year-9 |
|---|---|---|---|---|---|---|---|---|---|---|
| 2010's | 3,978 | 3,721 | 2,411 | 1,425 | 813 | 1,922 | 1,144 | |||
| 2020's | 998 | 1,194 | 700 | 418 | 781 |
| - = No Data Reported; -- = Not Applicable; NA = Not Available; W = Withheld to avoid disclosure of individual company data. |
| Release Date: 6/30/2026 |
| Next Release Date: 7/31/2026 |