|
Download Data (XLS File) |
|
||||||||
|
||||||||
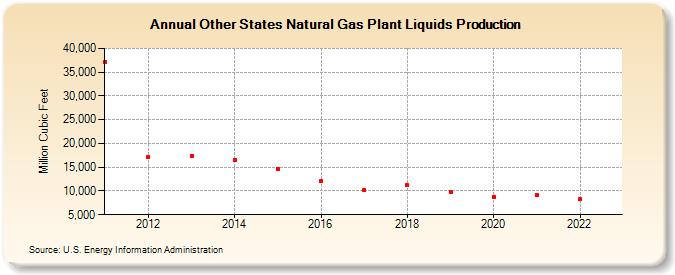
| Other States Natural Gas Plant Liquids Production (Million Cubic Feet) | ||||||||
| Decade | Year-0 | Year-1 | Year-2 | Year-3 | Year-4 | Year-5 | Year-6 | Year-7 | Year-8 | Year-9 |
|---|---|---|---|---|---|---|---|---|---|---|
| 2010's | 37,200 | 17,202 | 17,442 | 16,615 | 14,714 | 12,018 | 10,188 | 11,156 | 9,854 | |
| 2020's | 8,789 | 9,212 | 8,267 | 7,947 | 8,006 |
| - = No Data Reported; -- = Not Applicable; NA = Not Available; W = Withheld to avoid disclosure of individual company data. |
| Release Date: 6/30/2026 |
| Next Release Date: 7/31/2026 |