|
Download Data (XLS File) |
|
||||||||
|
||||||||
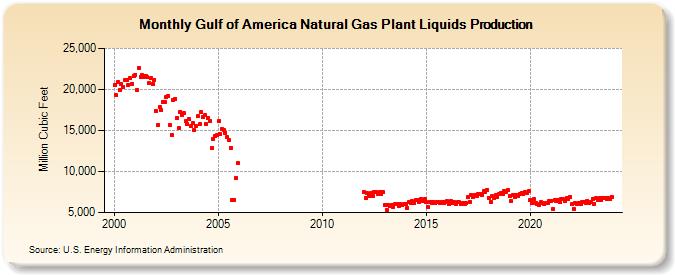
| Gulf of America Natural Gas Plant Liquids Production (Million Cubic Feet) | ||||||||
| Year | Jan | Feb | Mar | Apr | May | Jun | Jul | Aug | Sep | Oct | Nov | Dec |
|---|---|---|---|---|---|---|---|---|---|---|---|---|
| 2000 | 20,551 | 19,270 | 20,894 | 19,939 | 20,663 | 20,245 | 21,104 | 21,126 | 20,536 | 21,389 | 20,713 | 21,671 |
| 2001 | 21,798 | 19,976 | 22,592 | 21,525 | 21,720 | 21,558 | 21,693 | 21,475 | 20,745 | 21,373 | 20,658 | 21,191 |
| 2002 | 17,347 | 15,647 | 17,829 | 17,443 | 18,452 | 18,438 | 19,068 | 19,165 | 15,663 | 14,480 | 18,703 | 18,882 |
| 2003 | 16,559 | 15,245 | 17,297 | 16,860 | 17,078 | 16,109 | 15,778 | 16,379 | 15,497 | 15,863 | 15,044 | 15,500 |
| 2004 | 16,706 | 15,753 | 17,202 | 16,592 | 16,838 | 15,732 | 16,514 | 16,208 | 12,837 | 13,990 | 14,360 | 14,394 |
| 2005 | 16,096 | 14,523 | 15,176 | 15,003 | 14,750 | 14,195 | 13,809 | 12,897 | 6,471 | 6,536 | 9,189 | 10,985 |
| 2012 | 7,448 | 6,831 | 7,330 | 7,074 | 7,340 | 7,058 | 7,482 | 7,445 | 7,246 | 7,504 | 7,272 | 7,448 |
| 2013 | 5,875 | 5,322 | 5,876 | 5,760 | 5,931 | 5,732 | 6,040 | 6,027 | 5,817 | 6,029 | 5,895 | 5,989 |
| 2014 | 6,049 | 5,593 | 6,237 | 6,184 | 6,355 | 6,182 | 6,524 | 6,559 | 6,345 | 6,622 | 6,367 | 6,631 |
| 2015 | 6,272 | 5,694 | 6,331 | 6,216 | 6,330 | 6,112 | 6,336 | 6,343 | 6,177 | 6,336 | 6,106 | 6,310 |
| 2016 | 6,351 | 6,025 | 6,368 | 6,158 | 6,291 | 6,030 | 6,282 | 6,232 | 5,991 | 6,166 | 6,017 | 6,148 |
| 2017 | 6,903 | 6,322 | 7,158 | 6,935 | 7,167 | 7,003 | 7,311 | 7,307 | 7,195 | 7,566 | 7,550 | 7,756 |
| 2018 | 6,811 | 6,280 | 7,034 | 6,796 | 7,103 | 6,909 | 7,281 | 7,428 | 7,306 | 7,646 | 7,528 | 7,741 |
| 2019 | 7,016 | 6,380 | 7,096 | 6,901 | 7,185 | 6,973 | 7,245 | 7,421 | 7,209 | 7,515 | 7,392 | 7,629 |
| 2020 | 6,590 | 6,158 | 6,595 | 6,214 | 6,039 | 5,928 | 6,234 | 6,214 | 6,020 | 6,173 | 6,158 | 6,373 |
| 2021 | 6,462 | 5,405 | 6,526 | 6,365 | 6,572 | 6,337 | 6,610 | 6,630 | 6,459 | 6,781 | 6,636 | 6,915 |
| 2022 | 5,993 | 5,465 | 6,150 | 6,010 | 6,214 | 6,032 | 6,283 | 6,323 | 6,214 | 6,410 | 6,211 | 6,326 |
| 2023 | 6,723 | 6,049 | 6,793 | 6,519 | 6,793 | 6,497 | 6,765 | 6,806 | 6,600 | 6,827 | 6,707 | 6,940 |
| 2024 | 6,466 | 6,215 | 6,500 | 6,232 | 6,450 | 6,317 | 6,610 | 6,548 | 6,293 | 6,593 | 6,381 | 6,715 |
| - = No Data Reported; -- = Not Applicable; NA = Not Available; W = Withheld to avoid disclosure of individual company data. |
| Release Date: 6/30/2026 |
| Next Release Date: 7/31/2026 |