|
Download Data (XLS File) |
|
||||||||
|
||||||||
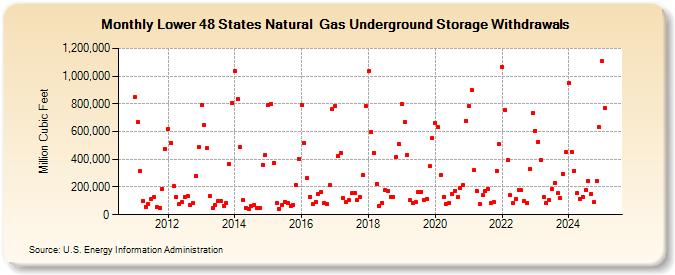
| Lower 48 States Natural Gas Underground Storage Withdrawals (Million Cubic Feet) | ||||||||
| Year | Jan | Feb | Mar | Apr | May | Jun | Jul | Aug | Sep | Oct | Nov | Dec |
|---|---|---|---|---|---|---|---|---|---|---|---|---|
| 2011 | 849,115 | 666,248 | 313,952 | 100,096 | 58,314 | 80,472 | 115,649 | 125,989 | 55,418 | 51,527 | 183,799 | 473,674 |
| 2012 | 619,332 | 515,817 | 205,365 | 126,403 | 73,735 | 90,800 | 129,567 | 133,919 | 66,652 | 85,918 | 280,933 | 489,707 |
| 2013 | 792,541 | 646,938 | 480,974 | 134,926 | 48,708 | 68,483 | 98,656 | 101,571 | 66,276 | 84,336 | 364,579 | 806,265 |
| 2014 | 1,038,470 | 831,640 | 486,648 | 105,087 | 50,482 | 43,221 | 62,920 | 73,069 | 46,860 | 51,270 | 360,985 | 428,692 |
| 2015 | 793,823 | 802,135 | 374,721 | 82,812 | 43,898 | 67,917 | 93,972 | 84,245 | 62,600 | 69,275 | 212,642 | 401,707 |
| 2016 | 794,258 | 514,239 | 263,650 | 129,845 | 73,726 | 93,589 | 149,976 | 161,574 | 88,049 | 77,519 | 212,010 | 760,074 |
| 2017 | 784,970 | 420,321 | 447,455 | 121,597 | 89,031 | 104,727 | 153,491 | 157,752 | 102,693 | 130,326 | 283,145 | 783,600 |
| 2018 | 1,034,242 | 597,238 | 447,589 | 223,355 | 65,430 | 87,517 | 175,109 | 171,709 | 129,686 | 130,670 | 416,969 | 508,818 |
| 2019 | 800,494 | 669,763 | 433,345 | 102,783 | 84,682 | 91,619 | 161,287 | 167,477 | 109,054 | 114,822 | 348,946 | 553,144 |
| 2020 | 660,537 | 631,762 | 282,957 | 129,725 | 73,818 | 84,779 | 150,953 | 173,859 | 126,148 | 190,250 | 212,615 | 679,236 |
| 2021 | 780,867 | 901,646 | 319,631 | 172,081 | 75,491 | 139,519 | 171,060 | 186,258 | 82,425 | 90,443 | 318,011 | 509,937 |
| 2022 | 1,066,461 | 758,872 | 393,401 | 140,077 | 81,285 | 114,168 | 181,613 | 176,197 | 99,890 | 88,103 | 331,578 | 732,332 |
| 2023 | 607,096 | 528,103 | 393,626 | 125,038 | 81,374 | 104,597 | 185,873 | 233,678 | 156,297 | 119,435 | 295,938 | 451,631 |
| 2024 | 947,750 | 455,403 | 318,073 | 154,492 | 111,949 | 127,936 | 176,395 | 243,786 | 150,744 | 93,495 | 244,498 | 630,730 |
| 2025 | 1,104,192 | 769,711 | 286,580 | 143,151 | 81,543 | 106,272 | 190,592 | 180,026 | 108,003 | 116,539 | 274,799 | 757,698 |
| 2026 | 1,011,112 | 649,279 | 298,590 | 145,761 | ||||||||
| - = No Data Reported; -- = Not Applicable; NA = Not Available; W = Withheld to avoid disclosure of individual company data. |
| Release Date: 6/30/2026 |
| Next Release Date: 7/31/2026 |