|
Download Data (XLS File) |
|
||||||||
|
||||||||
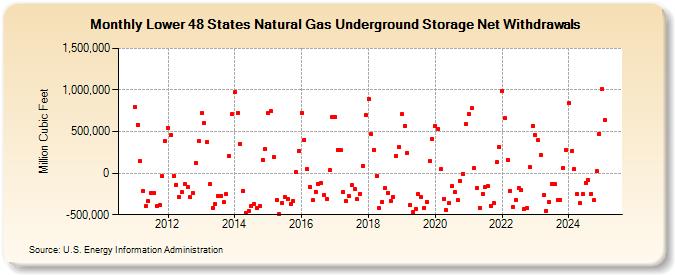
| Lower 48 States Natural Gas Underground Storage Net Withdrawals (Million Cubic Feet) | ||||||||
| Year | Jan | Feb | Mar | Apr | May | Jun | Jul | Aug | Sep | Oct | Nov | Dec |
|---|---|---|---|---|---|---|---|---|---|---|---|---|
| 2011 | 798,985 | 584,421 | 146,319 | -212,194 | -399,411 | -340,172 | -243,618 | -244,191 | -398,130 | -385,221 | -37,590 | 383,241 |
| 2012 | 544,477 | 459,574 | -34,987 | -137,493 | -284,231 | -232,226 | -134,343 | -165,879 | -290,456 | -241,849 | 125,379 | 384,754 |
| 2013 | 721,687 | 605,009 | 380,314 | -136,310 | -417,919 | -370,907 | -273,815 | -270,544 | -352,576 | -254,021 | 209,916 | 712,811 |
| 2014 | 970,871 | 727,603 | 353,651 | -216,741 | -477,379 | -461,091 | -399,247 | -372,803 | -420,968 | -400,405 | 161,568 | 287,134 |
| 2015 | 724,949 | 741,344 | 193,230 | -321,505 | -496,356 | -361,486 | -283,969 | -309,054 | -372,112 | -330,780 | 12,109 | 264,197 |
| 2016 | 728,716 | 403,550 | 49,034 | -163,038 | -326,593 | -220,859 | -131,091 | -121,769 | -261,066 | -308,536 | 34,420 | 673,752 |
| 2017 | 672,686 | 283,526 | 272,867 | -229,091 | -339,205 | -278,691 | -147,426 | -193,148 | -314,911 | -246,975 | 84,358 | 693,440 |
| 2018 | 893,495 | 464,929 | 284,013 | -31,796 | -422,203 | -346,803 | -184,516 | -233,570 | -332,528 | -289,780 | 204,505 | 318,661 |
| 2019 | 705,454 | 565,487 | 244,022 | -381,922 | -470,728 | -429,734 | -252,586 | -284,327 | -418,306 | -345,947 | 148,406 | 416,031 |
| 2020 | 566,130 | 533,098 | 46,841 | -306,600 | -446,957 | -356,624 | -159,412 | -225,164 | -321,686 | -92,187 | -5,300 | 585,646 |
| 2021 | 705,458 | 779,575 | 57,526 | -174,317 | -414,575 | -246,179 | -168,276 | -158,032 | -389,751 | -360,745 | 129,605 | 320,033 |
| 2022 | 991,146 | 657,068 | 162,605 | -213,632 | -401,436 | -321,061 | -177,716 | -203,896 | -433,651 | -421,751 | 70,581 | 572,543 |
| 2023 | 454,762 | 398,006 | 222,877 | -268,287 | -451,104 | -341,666 | -131,552 | -130,381 | -321,544 | -321,522 | 63,094 | 281,604 |
| 2024 | 841,485 | 260,903 | 44,987 | -255,932 | -361,195 | -251,592 | -117,493 | -76,945 | -248,981 | -327,578 | 21,122 | 474,368 |
| 2025 | 1,008,326 | 634,020 | -48,434 | -303,675 | -495,720 | -353,150 | -148,770 | -183,302 | -307,071 | -306,727 | 30,105 | 591,700 |
| 2026 | 903,485 | 499,952 | -7,347 | -306,850 | ||||||||
| - = No Data Reported; -- = Not Applicable; NA = Not Available; W = Withheld to avoid disclosure of individual company data. |
| Release Date: 6/30/2026 |
| Next Release Date: 7/31/2026 |