|
Download Data (XLS File) |
|
||||||||
|
||||||||
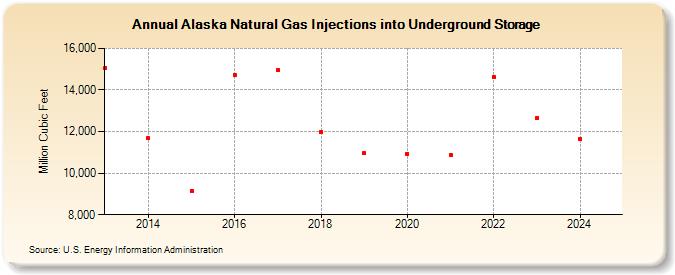
| Alaska Natural Gas Injections into Underground Storage (Million Cubic Feet) | ||||||||
| Decade | Year-0 | Year-1 | Year-2 | Year-3 | Year-4 | Year-5 | Year-6 | Year-7 | Year-8 | Year-9 |
|---|---|---|---|---|---|---|---|---|---|---|
| 2010's | 15,054 | 11,675 | 9,161 | 14,731 | 14,954 | 11,990 | 10,955 | |||
| 2020's | 10,938 | 10,885 | 14,639 | 12,662 | 11,635 | 15,344 |
| - = No Data Reported; -- = Not Applicable; NA = Not Available; W = Withheld to avoid disclosure of individual company data. |
| Release Date: 6/30/2026 |
| Next Release Date: 7/31/2026 |