|
Download Data (XLS File) |
|
||||||||
|
||||||||
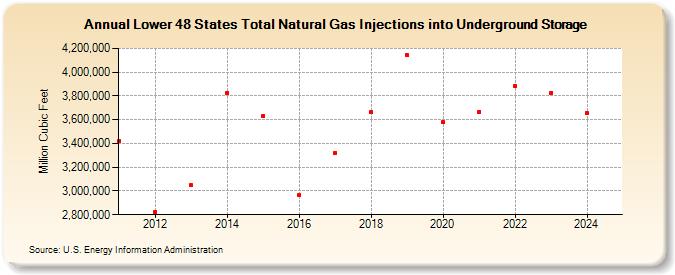
| Lower 48 States Total Natural Gas Injections into Underground Storage (Million Cubic Feet) | ||||||||
| Decade | Year-0 | Year-1 | Year-2 | Year-3 | Year-4 | Year-5 | Year-6 | Year-7 | Year-8 | Year-9 |
|---|---|---|---|---|---|---|---|---|---|---|
| 2010's | 3,421,813 | 2,825,427 | 3,047,153 | 3,827,150 | 3,629,179 | 2,961,990 | 3,321,680 | 3,663,923 | 4,141,567 | |
| 2020's | 3,578,854 | 3,667,048 | 3,883,178 | 3,828,398 | 3,652,104 | 4,001,804 |
| - = No Data Reported; -- = Not Applicable; NA = Not Available; W = Withheld to avoid disclosure of individual company data. |
| Release Date: 6/30/2026 |
| Next Release Date: 7/31/2026 |