|
Download Data (XLS File) |
|
|||||
|
|||||
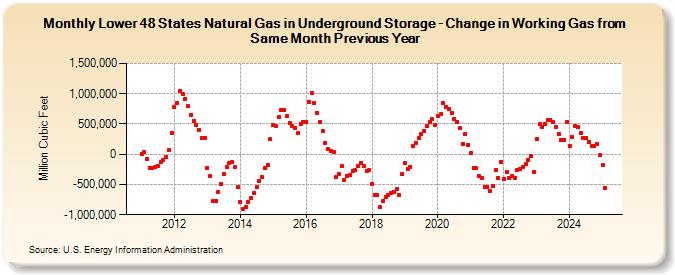
| Lower 48 States Natural Gas in Underground Storage - Change in Working Gas from Same Month Previous Year (Million Cubic Feet) | |||||
| Year | Jan | Feb | Mar | Apr | May | Jun | Jul | Aug | Sep | Oct | Nov | Dec |
|---|---|---|---|---|---|---|---|---|---|---|---|---|
| 2011 | 1,985 | 38,541 | -75,406 | -222,622 | -232,805 | -210,409 | -190,434 | -133,607 | -91,948 | -46,812 | 73,978 | 350,936 |
| 2012 | 778,578 | 852,002 | 1,047,322 | 994,769 | 911,345 | 800,040 | 655,845 | 556,041 | 481,190 | 406,811 | 271,902 | 259,915 |
| 2013 | -219,736 | -363,370 | -767,028 | -770,367 | -632,774 | -488,985 | -325,428 | -212,697 | -149,003 | -134,403 | -215,122 | -542,836 |
| 2014 | -785,392 | -905,121 | -869,358 | -794,926 | -727,048 | -643,238 | -542,307 | -448,294 | -380,854 | -231,291 | -181,496 | 246,151 |
| 2015 | 477,432 | 460,603 | 610,342 | 722,945 | 735,720 | 638,953 | 522,433 | 471,853 | 426,342 | 354,128 | 499,765 | 526,089 |
| 2016 | 531,483 | 868,580 | 1,013,996 | 850,000 | 674,667 | 533,749 | 386,156 | 190,247 | 80,064 | 59,776 | 39,828 | -377,972 |
| 2017 | -322,024 | -201,152 | -425,986 | -356,113 | -341,129 | -281,234 | -266,445 | -194,366 | -141,016 | -200,082 | -270,423 | -267,928 |
| 2018 | -484,841 | -667,329 | -675,437 | -866,563 | -780,497 | -712,667 | -673,405 | -632,897 | -616,614 | -580,262 | -680,316 | -325,173 |
| 2019 | -146,922 | -246,044 | -204,725 | 133,098 | 183,711 | 265,879 | 333,639 | 382,156 | 466,451 | 528,587 | 583,511 | 484,374 |
| 2020 | 628,038 | 660,190 | 851,022 | 780,211 | 753,842 | 679,837 | 586,598 | 530,639 | 430,240 | 171,407 | 326,754 | 157,068 |
| 2021 | 20,236 | -220,708 | -227,999 | -357,747 | -388,482 | -549,356 | -539,992 | -605,008 | -533,018 | -262,113 | -396,981 | -128,126 |
| 2022 | -415,155 | -293,850 | -397,122 | -360,852 | -385,709 | -258,167 | -248,753 | -208,102 | -162,076 | -98,160 | -35,062 | -288,686 |
| 2023 | 248,236 | 504,081 | 442,360 | 498,651 | 549,103 | 571,554 | 525,675 | 455,606 | 342,223 | 236,627 | 238,546 | 529,854 |
| 2024 | 142,943 | 279,739 | 458,685 | 448,627 | 369,115 | 275,625 | 260,620 | 203,726 | 127,037 | 132,697 | 176,457 | -16,596 |
| 2025 | -188,491 | -561,792 | -472,831 | -424,637 | -289,943 | -188,066 | -153,315 | -56,477 | 5,498 | -14,374 | -21,699 | -139,014 |
| 2026 | -24,707 | 110,677 | 69,284 | 67,912 | ||||||||
| - = No Data Reported; -- = Not Applicable; NA = Not Available; W = Withheld to avoid disclosure of individual company data. |
| Release Date: 6/30/2026 |
| Next Release Date: 7/31/2026 |