|
Download Data (XLS File) |
|
|||||
|
|||||
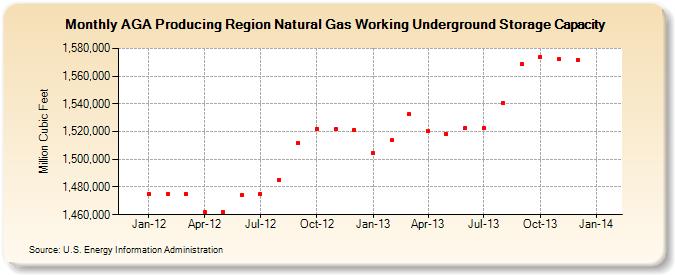
| AGA Producing Region Natural Gas Working Underground Storage Capacity (Million Cubic Feet) | |||||
| Year | Jan | Feb | Mar | Apr | May | Jun | Jul | Aug | Sep | Oct | Nov | Dec |
|---|---|---|---|---|---|---|---|---|---|---|---|---|
| 2012 | 1,475,140 | 1,475,140 | 1,475,140 | 1,461,840 | 1,461,840 | 1,474,475 | 1,474,974 | 1,485,054 | 1,512,070 | 1,522,137 | 1,521,815 | 1,521,450 |
| 2013 | 1,504,375 | 1,513,638 | 1,532,448 | 1,520,307 | 1,518,355 | 1,522,748 | 1,522,517 | 1,540,436 | 1,568,835 | 1,573,853 | 1,572,120 | 1,571,819 |
| - = No Data Reported; -- = Not Applicable; NA = Not Available; W = Withheld to avoid disclosure of individual company data. |
| Release Date: 6/30/2026 |
| Next Release Date: 7/31/2026 |