|
Download Data (XLS File) |
|
|||||
|
|||||
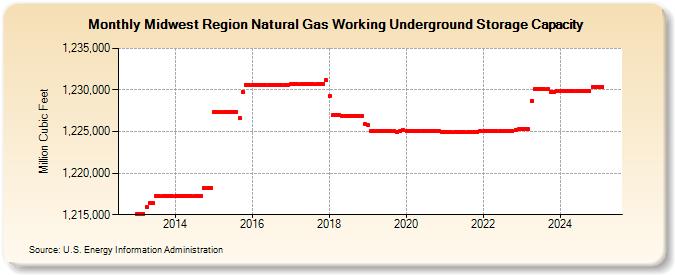
| Midwest Region Natural Gas Working Underground Storage Capacity (Million Cubic Feet) | |||||
| Year | Jan | Feb | Mar | Apr | May | Jun | Jul | Aug | Sep | Oct | Nov | Dec |
|---|---|---|---|---|---|---|---|---|---|---|---|---|
| 2013 | 1,215,098 | 1,215,098 | 1,215,098 | 1,215,908 | 1,216,353 | 1,216,353 | 1,217,215 | 1,217,215 | 1,217,215 | 1,217,215 | 1,217,215 | 1,217,215 |
| 2014 | 1,217,215 | 1,217,215 | 1,217,215 | 1,217,215 | 1,217,215 | 1,217,215 | 1,217,215 | 1,217,215 | 1,217,215 | 1,218,215 | 1,218,215 | 1,218,252 |
| 2015 | 1,227,354 | 1,227,354 | 1,227,354 | 1,227,354 | 1,227,354 | 1,227,354 | 1,227,354 | 1,227,354 | 1,226,627 | 1,229,783 | 1,230,615 | 1,230,615 |
| 2016 | 1,230,615 | 1,230,615 | 1,230,615 | 1,230,615 | 1,230,615 | 1,230,615 | 1,230,615 | 1,230,615 | 1,230,615 | 1,230,616 | 1,230,616 | 1,230,616 |
| 2017 | 1,230,697 | 1,230,697 | 1,230,680 | 1,230,680 | 1,230,680 | 1,230,680 | 1,230,680 | 1,230,680 | 1,230,680 | 1,230,756 | 1,230,756 | 1,231,148 |
| 2018 | 1,229,259 | 1,226,967 | 1,226,967 | 1,226,967 | 1,226,916 | 1,226,916 | 1,226,916 | 1,226,916 | 1,226,916 | 1,226,916 | 1,226,916 | 1,225,906 |
| 2019 | 1,225,831 | 1,225,076 | 1,225,076 | 1,225,076 | 1,225,076 | 1,225,076 | 1,225,076 | 1,225,076 | 1,225,076 | 1,224,986 | 1,225,076 | 1,225,171 |
| 2020 | 1,225,108 | 1,225,108 | 1,225,108 | 1,225,108 | 1,225,108 | 1,225,108 | 1,225,108 | 1,225,108 | 1,225,108 | 1,225,108 | 1,225,108 | 1,224,906 |
| 2021 | 1,224,906 | 1,224,906 | 1,224,906 | 1,224,906 | 1,224,906 | 1,224,906 | 1,224,906 | 1,224,906 | 1,224,906 | 1,224,906 | 1,224,906 | 1,225,039 |
| 2022 | 1,225,039 | 1,225,039 | 1,225,039 | 1,225,039 | 1,225,039 | 1,225,039 | 1,225,039 | 1,225,039 | 1,225,039 | 1,225,040 | 1,225,220 | 1,225,252 |
| 2023 | 1,225,252 | 1,225,252 | 1,225,252 | 1,228,728 | 1,230,096 | 1,230,096 | 1,230,096 | 1,230,096 | 1,230,096 | 1,229,810 | 1,229,810 | 1,229,853 |
| 2024 | 1,229,853 | 1,229,853 | 1,229,853 | 1,229,853 | 1,229,853 | 1,229,853 | 1,229,853 | 1,229,853 | 1,229,853 | 1,229,853 | 1,230,388 | 1,230,388 |
| 2025 | 1,230,388 | 1,230,388 | 1,230,388 | 1,230,388 | 1,230,388 | 1,230,388 | 1,230,388 | 1,230,388 | 1,230,388 | 1,230,388 | 1,230,388 | 1,230,327 |
| 2026 | 1,230,327 | 1,230,327 | 1,228,327 | 1,228,327 | ||||||||
| - = No Data Reported; -- = Not Applicable; NA = Not Available; W = Withheld to avoid disclosure of individual company data. |
| Release Date: 6/30/2026 |
| Next Release Date: 7/31/2026 |