|
Download Data (XLS File) |
|
|||||
|
|||||
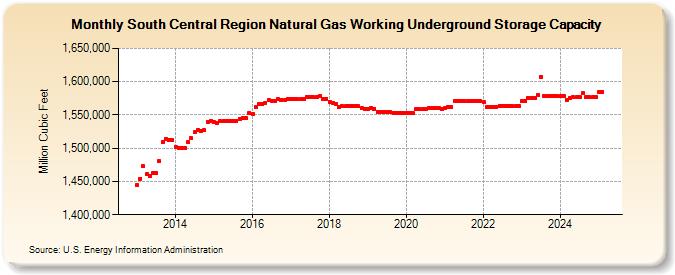
| South Central Region Natural Gas Working Underground Storage Capacity (Million Cubic Feet) | |||||
| Year | Jan | Feb | Mar | Apr | May | Jun | Jul | Aug | Sep | Oct | Nov | Dec |
|---|---|---|---|---|---|---|---|---|---|---|---|---|
| 2013 | 1,444,637 | 1,453,900 | 1,472,710 | 1,460,569 | 1,458,617 | 1,463,010 | 1,462,779 | 1,480,699 | 1,509,097 | 1,514,115 | 1,512,382 | 1,512,081 |
| 2014 | 1,502,353 | 1,500,533 | 1,500,747 | 1,500,124 | 1,508,726 | 1,514,839 | 1,524,157 | 1,527,860 | 1,526,234 | 1,527,132 | 1,539,896 | 1,540,638 |
| 2015 | 1,539,252 | 1,538,450 | 1,540,860 | 1,541,047 | 1,541,047 | 1,540,969 | 1,540,969 | 1,540,860 | 1,544,331 | 1,545,016 | 1,545,016 | 1,553,220 |
| 2016 | 1,551,203 | 1,561,263 | 1,565,677 | 1,566,091 | 1,567,581 | 1,572,198 | 1,571,422 | 1,571,422 | 1,573,402 | 1,573,098 | 1,573,098 | 1,574,038 |
| 2017 | 1,573,337 | 1,573,337 | 1,573,337 | 1,573,337 | 1,573,337 | 1,577,063 | 1,576,793 | 1,576,592 | 1,576,229 | 1,577,995 | 1,574,630 | 1,574,415 |
| 2018 | 1,570,072 | 1,568,552 | 1,566,270 | 1,562,150 | 1,562,776 | 1,562,776 | 1,562,776 | 1,562,776 | 1,562,776 | 1,562,776 | 1,559,682 | 1,559,432 |
| 2019 | 1,559,542 | 1,560,957 | 1,559,542 | 1,554,643 | 1,554,643 | 1,553,728 | 1,553,646 | 1,553,646 | 1,553,592 | 1,553,565 | 1,553,565 | 1,553,510 |
| 2020 | 1,553,485 | 1,553,459 | 1,552,314 | 1,558,275 | 1,558,247 | 1,558,221 | 1,558,189 | 1,560,510 | 1,560,484 | 1,560,452 | 1,560,633 | 1,558,259 |
| 2021 | 1,560,368 | 1,562,251 | 1,562,227 | 1,570,731 | 1,570,705 | 1,570,678 | 1,570,652 | 1,570,625 | 1,570,458 | 1,570,905 | 1,571,058 | 1,570,551 |
| 2022 | 1,569,554 | 1,562,550 | 1,562,550 | 1,562,387 | 1,562,371 | 1,563,485 | 1,563,458 | 1,563,431 | 1,563,396 | 1,563,367 | 1,563,430 | 1,563,403 |
| 2023 | 1,570,450 | 1,570,400 | 1,576,134 | 1,576,108 | 1,576,082 | 1,580,056 | 1,607,720 | 1,578,602 | 1,578,578 | 1,578,447 | 1,578,422 | 1,578,396 |
| 2024 | 1,564,889 | 1,564,880 | 1,559,628 | 1,562,409 | 1,562,908 | 1,562,883 | 1,562,840 | 1,569,310 | 1,563,229 | 1,562,881 | 1,562,855 | 1,562,829 |
| 2025 | 1,570,365 | 1,570,341 | 1,570,316 | 1,570,290 | 1,570,265 | 1,570,769 | 1,583,343 | 1,584,312 | 1,584,386 | 1,584,203 | 1,584,473 | 1,584,476 |
| 2026 | 1,581,336 | 1,581,307 | 1,581,275 | 1,582,258 | ||||||||
| - = No Data Reported; -- = Not Applicable; NA = Not Available; W = Withheld to avoid disclosure of individual company data. |
| Release Date: 6/30/2026 |
| Next Release Date: 7/31/2026 |