|
Download Data (XLS File) |
|
|||||
|
|||||
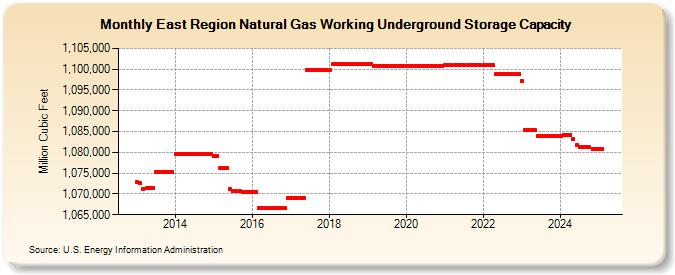
| East Region Natural Gas Working Underground Storage Capacity (Million Cubic Feet) | |||||
| Year | Jan | Feb | Mar | Apr | May | Jun | Jul | Aug | Sep | Oct | Nov | Dec |
|---|---|---|---|---|---|---|---|---|---|---|---|---|
| 2013 | 1,072,800 | 1,072,614 | 1,071,162 | 1,071,354 | 1,071,350 | 1,071,346 | 1,075,366 | 1,075,362 | 1,075,358 | 1,075,354 | 1,075,350 | 1,075,350 |
| 2014 | 1,079,641 | 1,079,641 | 1,079,633 | 1,079,629 | 1,079,629 | 1,079,621 | 1,079,618 | 1,079,614 | 1,079,610 | 1,079,610 | 1,079,602 | 1,079,598 |
| 2015 | 1,079,010 | 1,079,010 | 1,076,330 | 1,076,330 | 1,076,330 | 1,071,255 | 1,070,585 | 1,070,585 | 1,070,585 | 1,070,582 | 1,070,582 | 1,070,576 |
| 2016 | 1,070,575 | 1,070,575 | 1,066,634 | 1,066,630 | 1,066,630 | 1,066,622 | 1,066,619 | 1,066,616 | 1,066,613 | 1,066,610 | 1,066,607 | 1,069,117 |
| 2017 | 1,069,115 | 1,069,113 | 1,069,109 | 1,069,109 | 1,069,107 | 1,099,882 | 1,099,872 | 1,099,872 | 1,099,870 | 1,099,870 | 1,099,870 | 1,099,857 |
| 2018 | 1,099,855 | 1,101,205 | 1,101,196 | 1,101,196 | 1,101,188 | 1,101,185 | 1,101,185 | 1,101,178 | 1,101,180 | 1,101,171 | 1,101,167 | 1,101,164 |
| 2019 | 1,101,162 | 1,101,351 | 1,100,878 | 1,100,878 | 1,100,871 | 1,100,871 | 1,100,871 | 1,100,871 | 1,100,871 | 1,100,871 | 1,100,871 | 1,100,871 |
| 2020 | 1,100,871 | 1,100,871 | 1,100,871 | 1,100,871 | 1,100,871 | 1,100,871 | 1,100,871 | 1,100,871 | 1,100,871 | 1,100,871 | 1,100,871 | 1,100,871 |
| 2021 | 1,100,896 | 1,100,896 | 1,100,896 | 1,100,896 | 1,100,896 | 1,100,896 | 1,100,896 | 1,100,896 | 1,100,896 | 1,100,896 | 1,100,896 | 1,100,896 |
| 2022 | 1,100,896 | 1,100,896 | 1,100,896 | 1,100,896 | 1,098,958 | 1,098,958 | 1,098,958 | 1,098,958 | 1,098,958 | 1,098,958 | 1,098,958 | 1,098,958 |
| 2023 | 1,097,126 | 1,085,408 | 1,085,405 | 1,085,401 | 1,085,397 | 1,084,005 | 1,084,002 | 1,083,999 | 1,083,996 | 1,083,993 | 1,083,990 | 1,083,987 |
| 2024 | 1,083,984 | 1,084,080 | 1,084,077 | 1,084,074 | 1,083,199 | 1,081,734 | 1,081,353 | 1,081,351 | 1,081,344 | 1,081,344 | 1,080,756 | 1,080,753 |
| 2025 | 1,080,750 | 1,080,747 | 1,079,060 | 1,078,915 | 1,078,915 | 1,078,912 | 1,078,910 | 1,078,907 | 1,078,904 | 1,078,901 | 1,078,900 | 1,078,898 |
| 2026 | 1,078,895 | 1,078,616 | 1,078,613 | 1,078,611 | ||||||||
| - = No Data Reported; -- = Not Applicable; NA = Not Available; W = Withheld to avoid disclosure of individual company data. |
| Release Date: 6/30/2026 |
| Next Release Date: 7/31/2026 |