|
Download Data (XLS File) |
|
||||||||
|
||||||||
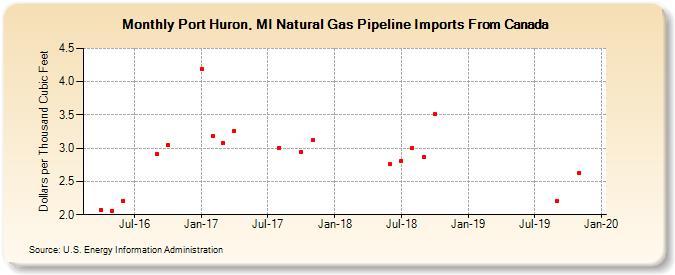
| Port Huron, MI Natural Gas Pipeline Imports From Canada (Dollars per Thousand Cubic Feet) | ||||||||
| Year | Jan | Feb | Mar | Apr | May | Jun | Jul | Aug | Sep | Oct | Nov | Dec |
|---|---|---|---|---|---|---|---|---|---|---|---|---|
| 2016 | 2.07 | 2.06 | 2.21 | 2.91 | 3.05 | |||||||
| 2017 | 4.19 | 3.18 | 3.08 | 3.26 | 3.01 | 2.94 | 3.12 | |||||
| 2018 | 2.76 | 2.81 | 3.01 | 2.86 | 3.51 | |||||||
| 2019 | 2.20 | 2.63 | ||||||||||
| 2026 | 2.89 | |||||||||||
| - = No Data Reported; -- = Not Applicable; NA = Not Available; W = Withheld to avoid disclosure of individual company data. |
| Release Date: 6/30/2026 |
| Next Release Date: 7/31/2026 |