|
Download Data (XLS File) |
|
||||||||
|
||||||||
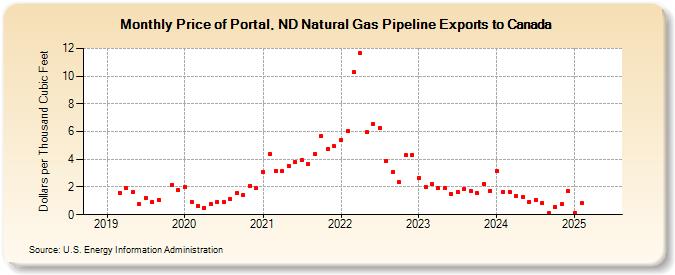
| Price of Portal, ND Natural Gas Pipeline Exports to Canada (Dollars per Thousand Cubic Feet) | ||||||||
| Year | Jan | Feb | Mar | Apr | May | Jun | Jul | Aug | Sep | Oct | Nov | Dec |
|---|---|---|---|---|---|---|---|---|---|---|---|---|
| 2019 | 1.59 | 1.91 | 1.65 | 0.74 | 1.23 | 0.93 | 1.08 | 2.17 | 1.77 | |||
| 2020 | 2.00 | 0.95 | 0.64 | 0.52 | 0.79 | 0.91 | 0.91 | 1.12 | 1.54 | 1.43 | 2.09 | 1.90 |
| 2021 | 3.08 | 4.37 | 3.19 | 3.13 | 3.53 | 3.79 | 3.94 | 3.64 | 4.39 | 5.65 | 4.76 | 4.93 |
| 2022 | 5.40 | 6.03 | 10.28 | 11.69 | 5.94 | 6.54 | 6.25 | 3.87 | 3.08 | 2.33 | 4.29 | 4.31 |
| 2023 | 2.68 | 2.01 | 2.21 | 1.90 | 1.92 | 1.50 | 1.65 | 1.86 | 1.69 | 1.53 | 2.22 | 1.72 |
| 2024 | 3.17 | 1.66 | 1.64 | 1.33 | 1.28 | 0.95 | 1.05 | 0.81 | 0.09 | 0.56 | 0.74 | 1.69 |
| 2025 | 0.11 | 0.81 | 0.42 | 1.39 | 1.06 | 0.45 | 0.46 | 0.45 | 0.63 | 0.53 | 1.63 | 2.19 |
| 2026 | 2.38 | 1.53 | 1.28 | 0.91 | ||||||||
| - = No Data Reported; -- = Not Applicable; NA = Not Available; W = Withheld to avoid disclosure of individual company data. |
| Release Date: 6/30/2026 |
| Next Release Date: 7/31/2026 |