|
Download Data (XLS File) |
|
||||||||
|
||||||||
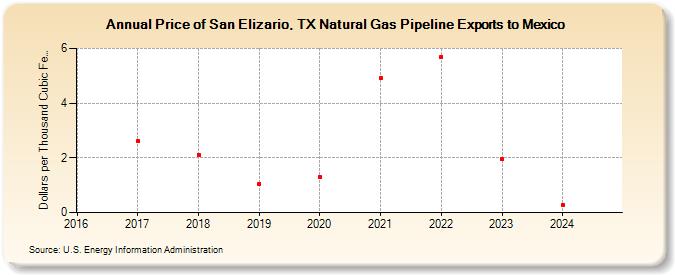
| Price of San Elizario, TX Natural Gas Pipeline Exports to Mexico (Dollars per Thousand Cubic Feet) | ||||||||
| Decade | Year-0 | Year-1 | Year-2 | Year-3 | Year-4 | Year-5 | Year-6 | Year-7 | Year-8 | Year-9 |
|---|---|---|---|---|---|---|---|---|---|---|
| 2010's | -- | 2.62 | 2.12 | 1.06 | ||||||
| 2020's | 1.31 | 4.90 | 5.69 | 2.10 | 0.29 | 1.07 |
| - = No Data Reported; -- = Not Applicable; NA = Not Available; W = Withheld to avoid disclosure of individual company data. |
| Release Date: 6/30/2026 |
| Next Release Date: 7/31/2026 |