|
Download Data (XLS File) |
|
||||||||
|
||||||||
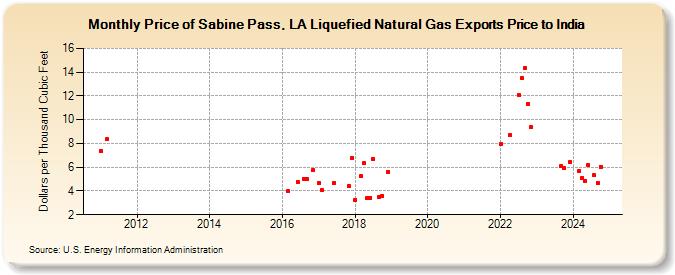
| Price of Sabine Pass, LA Liquefied Natural Gas Exports Price to India (Dollars per Thousand Cubic Feet) | ||||||||
| Year | Jan | Feb | Mar | Apr | May | Jun | Jul | Aug | Sep | Oct | Nov | Dec |
|---|---|---|---|---|---|---|---|---|---|---|---|---|
| 2011 | 7.40 | 8.35 | ||||||||||
| 2016 | 3.98 | 4.77 | 5.01 | 5.00 | 5.74 | |||||||
| 2017 | 4.70 | 4.06 | 4.67 | 4.41 | 6.80 | |||||||
| 2018 | 3.27 | 5.22 | 6.33 | 3.37 | 3.44 | 6.70 | 3.46 | 3.61 | 5.63 | |||
| 2019 | W | W | W | W | W | W | W | W | W | W | ||
| 2020 | W | W | W | W | W | W | W | |||||
| 2021 | W | W | W | W | W | W | W | |||||
| 2022 | 7.96 | 8.69 | 12.08 | 13.54 | 14.33 | 11.36 | 9.35 | |||||
| 2023 | 6.91 | 5.57 | 5.72 | 6.31 | 6.07 | 5.92 | 6.43 | |||||
| 2024 | 6.19 | 5.69 | 5.10 | 4.85 | 6.19 | 6.36 | 5.32 | 4.66 | 6.05 | 5.53 | ||
| 2025 | W | W | W | W | ||||||||
| 2026 | W | W | ||||||||||
| - = No Data Reported; -- = Not Applicable; NA = Not Available; W = Withheld to avoid disclosure of individual company data. |
| Release Date: 6/30/2026 |
| Next Release Date: 7/31/2026 |