|
Download Data (XLS File) |
|
||||||||
|
||||||||
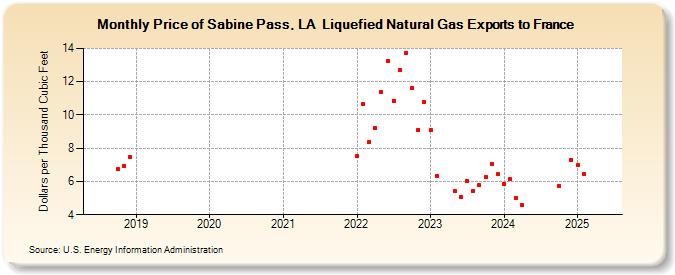
| Price of Sabine Pass, LA Liquefied Natural Gas Exports to France (Dollars per Thousand Cubic Feet) | ||||||||
| Year | Jan | Feb | Mar | Apr | May | Jun | Jul | Aug | Sep | Oct | Nov | Dec |
|---|---|---|---|---|---|---|---|---|---|---|---|---|
| 2018 | 6.72 | 6.92 | 7.47 | |||||||||
| 2019 | W | W | W | W | W | W | W | W | W | |||
| 2020 | W | W | W | W | W | W | ||||||
| 2021 | W | W | W | W | W | W | W | W | W | W | ||
| 2022 | 7.53 | 10.64 | 8.36 | 9.23 | 11.38 | 13.23 | 10.86 | 12.69 | 13.73 | 11.63 | 9.09 | 10.80 |
| 2023 | 9.08 | 6.34 | 6.12 | 5.42 | 5.08 | 6.04 | 5.45 | 5.78 | 6.26 | 7.06 | 6.43 | |
| 2024 | 5.87 | 6.12 | 5.03 | 4.57 | 5.13 | 5.75 | 4.32 | 4.91 | 5.73 | 7.31 | ||
| 2025 | W | W | W | W | W | W | W | W | W | W | W | |
| 2026 | W | W | W | W | ||||||||
| - = No Data Reported; -- = Not Applicable; NA = Not Available; W = Withheld to avoid disclosure of individual company data. |
| Release Date: 6/30/2026 |
| Next Release Date: 7/31/2026 |