|
Download Data (XLS File) |
|
||||||||
|
||||||||
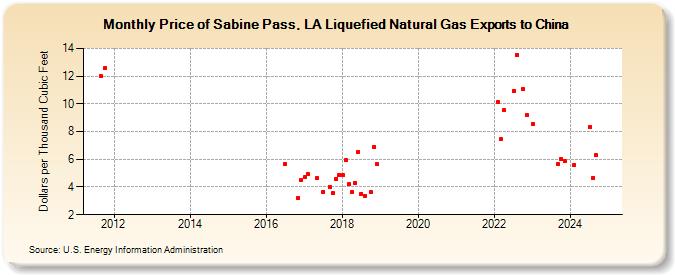
| Price of Sabine Pass, LA Liquefied Natural Gas Exports to China (Dollars per Thousand Cubic Feet) | ||||||||
| Year | Jan | Feb | Mar | Apr | May | Jun | Jul | Aug | Sep | Oct | Nov | Dec |
|---|---|---|---|---|---|---|---|---|---|---|---|---|
| 2011 | 11.98 | 12.56 | ||||||||||
| 2016 | 5.66 | 3.21 | 4.50 | |||||||||
| 2017 | 4.70 | 4.92 | 4.62 | 3.67 | 3.99 | 3.56 | 4.60 | 4.87 | ||||
| 2018 | 4.84 | 5.93 | 4.20 | 3.67 | 4.31 | 6.56 | 3.53 | 3.38 | 3.61 | 6.92 | 5.63 | |
| 2019 | W | W | ||||||||||
| 2020 | W | W | W | W | W | W | W | |||||
| 2021 | W | W | W | W | W | W | W | W | W | W | W | |
| 2022 | 10.15 | 7.45 | 9.53 | 10.94 | 13.54 | 11.04 | 9.17 | |||||
| 2023 | 8.56 | 11.12 | 6.30 | 5.03 | 5.66 | 6.01 | 5.91 | |||||
| 2024 | 5.16 | 5.59 | 5.09 | 4.57 | 5.59 | 8.36 | 4.68 | 6.29 | 5.12 | 5.41 | ||
| - = No Data Reported; -- = Not Applicable; NA = Not Available; W = Withheld to avoid disclosure of individual company data. |
| Release Date: 6/30/2026 |
| Next Release Date: 7/31/2026 |