|
Download Data (XLS File) |
|
||||||||
|
||||||||
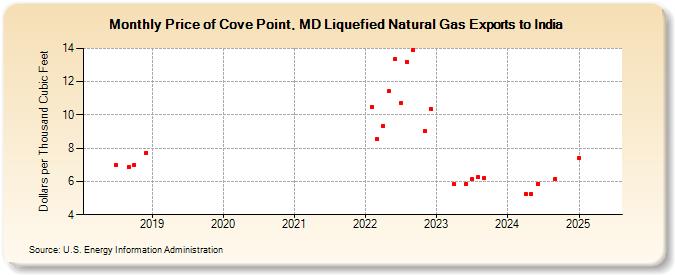
| Price of Cove Point, MD Liquefied Natural Gas Exports to India (Dollars per Thousand Cubic Feet) | ||||||||
| Year | Jan | Feb | Mar | Apr | May | Jun | Jul | Aug | Sep | Oct | Nov | Dec |
|---|---|---|---|---|---|---|---|---|---|---|---|---|
| 2018 | 6.99 | 6.88 | 6.99 | 7.74 | ||||||||
| 2019 | W | W | W | W | W | |||||||
| 2020 | W | W | W | W | W | |||||||
| 2021 | W | W | W | W | W | |||||||
| 2022 | 10.50 | 8.53 | 9.35 | 11.41 | 13.37 | 10.74 | 13.21 | 13.93 | 9.03 | 10.37 | ||
| 2023 | 8.68 | 7.00 | 6.45 | 5.82 | 5.84 | 6.12 | 6.24 | 6.18 | 6.43 | 6.85 | 6.58 | |
| 2024 | 6.47 | 5.26 | 5.26 | 5.87 | 6.31 | 5.54 | 6.15 | 6.06 | 7.19 | |||
| 2025 | W | W | W | W | W | W | W | W | W | W | W | W |
| 2026 | W | W | W | |||||||||
| - = No Data Reported; -- = Not Applicable; NA = Not Available; W = Withheld to avoid disclosure of individual company data. |
| Release Date: 5/29/2026 |
| Next Release Date: 6/30/2026 |