|
Download Data (XLS File) |
|
||||||||
|
||||||||
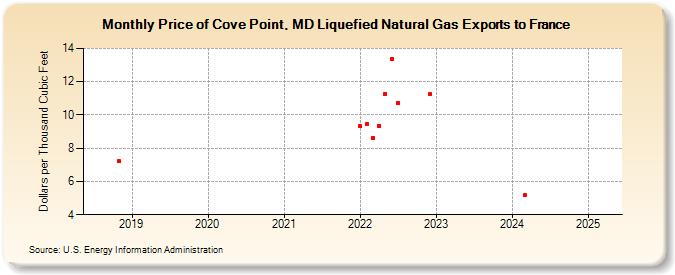
| Price of Cove Point, MD Liquefied Natural Gas Exports to France (Dollars per Thousand Cubic Feet) | ||||||||
| Year | Jan | Feb | Mar | Apr | May | Jun | Jul | Aug | Sep | Oct | Nov | Dec |
|---|---|---|---|---|---|---|---|---|---|---|---|---|
| 2018 | 7.21 | |||||||||||
| 2019 | W | W | ||||||||||
| 2020 | W | W | W | |||||||||
| 2021 | W | W | ||||||||||
| 2022 | 9.31 | 9.44 | 8.63 | 9.34 | 11.27 | 13.36 | 10.74 | 11.24 | ||||
| 2023 | 6.11 | 6.49 | ||||||||||
| 2024 | 6.28 | 5.16 | 5.97 | 7.87 | ||||||||
| 2025 | W | W | W | W | W | W | ||||||
| 2026 | W | |||||||||||
| - = No Data Reported; -- = Not Applicable; NA = Not Available; W = Withheld to avoid disclosure of individual company data. |
| Release Date: 6/30/2026 |
| Next Release Date: 7/31/2026 |