|
Download Data (XLS File) |
|
||||||||
|
||||||||
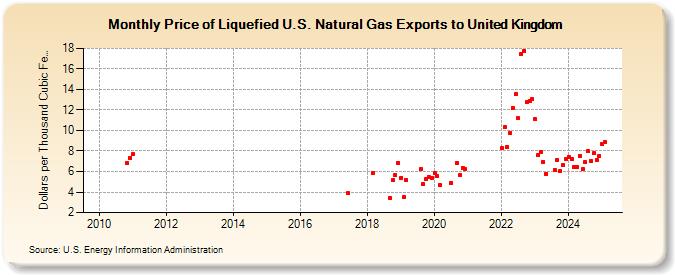
| Price of Liquefied U.S. Natural Gas Exports to United Kingdom (Dollars per Thousand Cubic Feet) | ||||||||
| Year | Jan | Feb | Mar | Apr | May | Jun | Jul | Aug | Sep | Oct | Nov | Dec |
|---|---|---|---|---|---|---|---|---|---|---|---|---|
| 2010 | -- | -- | -- | -- | -- | -- | -- | -- | -- | -- | 6.79 | 7.32 |
| 2011 | 7.66 | -- | -- | -- | -- | -- | -- | -- | -- | -- | -- | -- |
| 2013 | -- | -- | -- | -- | -- | -- | -- | -- | -- | -- | -- | -- |
| 2014 | -- | |||||||||||
| 2015 | -- | -- | -- | -- | -- | -- | -- | -- | -- | -- | -- | -- |
| 2016 | -- | -- | -- | -- | -- | -- | -- | -- | -- | -- | -- | -- |
| 2017 | -- | -- | -- | -- | -- | 3.87 | -- | -- | -- | -- | -- | -- |
| 2018 | -- | -- | 5.89 | -- | -- | -- | -- | -- | 3.46 | 5.13 | 5.65 | 6.87 |
| 2019 | 5.40 | 3.52 | 5.15 | -- | -- | -- | -- | 6.20 | 4.77 | 5.23 | 5.45 | 5.41 |
| 2020 | 5.82 | 5.52 | 4.68 | -- | -- | -- | 4.91 | -- | 6.85 | 5.64 | 6.37 | 6.23 |
| 2021 | W | W | W | W | W | W | W | W | W | |||
| 2022 | 8.25 | 10.31 | 8.38 | 9.75 | 12.21 | 13.53 | 11.18 | 17.43 | 17.75 | 12.75 | 12.90 | 13.05 |
| 2023 | 11.07 | 7.58 | 7.95 | 6.93 | 5.80 | -- | -- | 6.19 | 7.14 | 6.05 | 6.66 | 7.18 |
| 2024 | 7.41 | 7.22 | 6.47 | 6.40 | 7.48 | 6.20 | 6.90 | 7.97 | 7.05 | 7.78 | 7.15 | 7.53 |
| 2025 | 8.70 | 8.75 | 9.02 | 8.68 | 7.62 | 9.10 | 6.06 | -- | 8.34 | 7.48 | 7.75 | 8.18 |
| 2026 | 8.70 | 11.01 | 9.28 | 8.39 | ||||||||
| - = No Data Reported; -- = Not Applicable; NA = Not Available; W = Withheld to avoid disclosure of individual company data. |
| Release Date: 6/30/2026 |
| Next Release Date: 7/31/2026 |