|
Download Data (XLS File) |
|
||||||||
|
||||||||
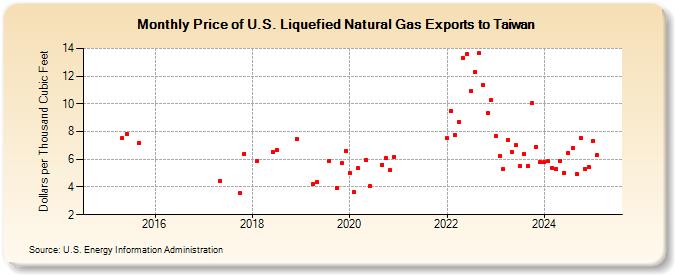
| Price of U.S. Liquefied Natural Gas Exports to Taiwan (Dollars per Thousand Cubic Feet) | ||||||||
| Year | Jan | Feb | Mar | Apr | May | Jun | Jul | Aug | Sep | Oct | Nov | Dec |
|---|---|---|---|---|---|---|---|---|---|---|---|---|
| 2015 | -- | -- | -- | -- | 7.50 | 7.80 | -- | -- | 7.16 | -- | -- | -- |
| 2016 | -- | -- | -- | -- | -- | -- | -- | -- | -- | -- | -- | -- |
| 2017 | -- | -- | -- | -- | 4.43 | -- | -- | -- | -- | 3.56 | 6.41 | -- |
| 2018 | -- | 5.89 | -- | -- | -- | 6.56 | 6.70 | -- | -- | -- | -- | 7.49 |
| 2019 | -- | -- | -- | 4.23 | 4.37 | -- | -- | 5.90 | -- | 3.94 | 5.71 | 6.60 |
| 2020 | 5.02 | 3.65 | 5.34 | -- | 5.97 | 4.05 | -- | -- | 5.61 | 6.07 | 5.21 | 6.19 |
| 2021 | W | W | W | W | W | W | W | W | W | W | W | |
| 2022 | 7.51 | 9.49 | 7.76 | 8.70 | 13.32 | 13.56 | 10.94 | 12.31 | 13.64 | 11.33 | 9.31 | 10.30 |
| 2023 | 7.68 | 6.26 | 5.29 | 7.40 | 6.52 | 7.03 | 5.53 | 6.41 | 5.54 | 10.04 | 6.90 | 5.78 |
| 2024 | 5.80 | 5.84 | 5.39 | 5.30 | 5.91 | 5.03 | 6.48 | 6.82 | 4.93 | 7.57 | 5.33 | 5.46 |
| 2025 | 7.31 | 6.28 | 7.78 | 8.04 | 7.10 | 7.93 | 6.53 | 7.91 | 6.86 | 6.16 | 7.22 | 8.22 |
| 2026 | 8.68 | 10.13 | 8.35 | 8.08 | ||||||||
| - = No Data Reported; -- = Not Applicable; NA = Not Available; W = Withheld to avoid disclosure of individual company data. |
| Release Date: 6/30/2026 |
| Next Release Date: 7/31/2026 |