|
Download Data (XLS File) |
|
||||||||
|
||||||||
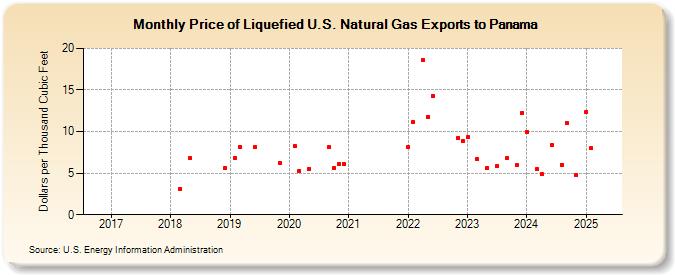
| Price of Liquefied U.S. Natural Gas Exports to Panama (Dollars per Thousand Cubic Feet) | ||||||||
| Year | Jan | Feb | Mar | Apr | May | Jun | Jul | Aug | Sep | Oct | Nov | Dec |
|---|---|---|---|---|---|---|---|---|---|---|---|---|
| 2017 | -- | -- | -- | -- | -- | -- | -- | -- | -- | -- | -- | -- |
| 2018 | -- | -- | 3.15 | -- | 6.80 | -- | -- | -- | -- | -- | -- | 5.63 |
| 2019 | -- | 6.84 | 8.12 | -- | -- | 8.12 | -- | -- | -- | -- | 6.22 | -- |
| 2020 | -- | 8.26 | 5.31 | -- | 5.54 | -- | -- | -- | 8.10 | 5.64 | 6.11 | 6.08 |
| 2021 | W | W | W | W | W | |||||||
| 2022 | 8.17 | 11.17 | -- | 18.60 | 11.80 | 14.33 | -- | -- | -- | -- | 9.21 | 8.89 |
| 2023 | 9.32 | -- | 6.66 | -- | 5.64 | -- | 5.85 | -- | 6.78 | -- | 5.93 | 12.22 |
| 2024 | 10.00 | -- | 5.49 | 4.85 | -- | 8.35 | -- | 6.03 | 11.04 | -- | 4.73 | -- |
| 2025 | 12.41 | 7.99 | 7.89 | 6.62 | 6.83 | 7.06 | 7.68 | 7.45 | -- | 10.46 | -- | -- |
| 2026 | 9.38 | 12.70 | -- | 6.93 | ||||||||
| - = No Data Reported; -- = Not Applicable; NA = Not Available; W = Withheld to avoid disclosure of individual company data. |
| Release Date: 6/30/2026 |
| Next Release Date: 7/31/2026 |