|
Download Data (XLS File) |
|
||||||||
|
||||||||
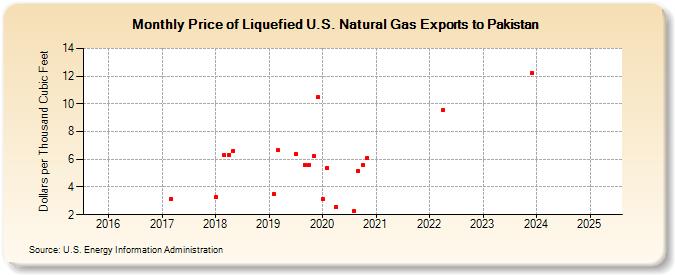
| Price of Liquefied U.S. Natural Gas Exports to Pakistan (Dollars per Thousand Cubic Feet) | ||||||||
| Year | Jan | Feb | Mar | Apr | May | Jun | Jul | Aug | Sep | Oct | Nov | Dec |
|---|---|---|---|---|---|---|---|---|---|---|---|---|
| 2016 | -- | -- | -- | -- | -- | -- | -- | -- | -- | -- | -- | -- |
| 2017 | -- | -- | 3.14 | -- | -- | -- | -- | -- | -- | -- | -- | -- |
| 2018 | 3.27 | -- | 6.28 | 6.33 | 6.63 | -- | -- | -- | -- | -- | -- | -- |
| 2019 | -- | 3.52 | 6.64 | -- | -- | -- | 6.39 | -- | 5.61 | 5.58 | 6.22 | 10.46 |
| 2020 | 3.13 | 5.40 | -- | 2.56 | -- | -- | -- | 2.25 | 5.16 | 5.60 | 6.11 | -- |
| 2021 | W | W | W | W | W | W | W | W | W | |||
| 2022 | -- | -- | -- | 9.53 | -- | -- | -- | -- | -- | -- | -- | -- |
| 2023 | -- | -- | -- | -- | -- | -- | -- | -- | -- | -- | -- | 12.22 |
| 2024 | -- | -- | -- | -- | -- | -- | -- | -- | -- | -- | -- | -- |
| 2025 | -- | -- | -- | -- | -- | -- | -- | -- | -- | -- | -- | -- |
| 2026 | -- | -- | 6.77 | -- | ||||||||
| - = No Data Reported; -- = Not Applicable; NA = Not Available; W = Withheld to avoid disclosure of individual company data. |
| Release Date: 6/30/2026 |
| Next Release Date: 7/31/2026 |