|
Download Data (XLS File) |
|
||||||||
|
||||||||
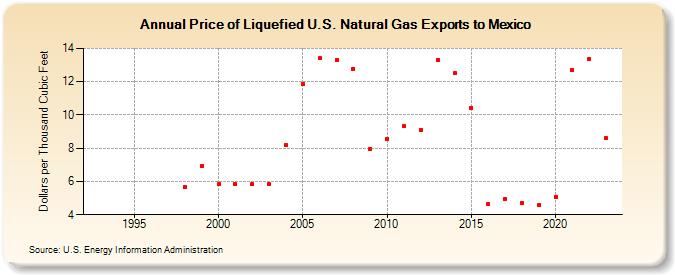
| Price of Liquefied U.S. Natural Gas Exports to Mexico (Dollars per Thousand Cubic Feet) | ||||||||
| Decade | Year-0 | Year-1 | Year-2 | Year-3 | Year-4 | Year-5 | Year-6 | Year-7 | Year-8 | Year-9 |
|---|---|---|---|---|---|---|---|---|---|---|
| 1990's | -- | -- | -- | -- | -- | -- | 5.69 | 6.95 | ||
| 2000's | 5.82 | 5.82 | 5.82 | 5.82 | 8.19 | 11.87 | 13.40 | 13.30 | 12.76 | 7.97 |
| 2010's | 8.58 | 9.31 | 9.09 | 13.33 | 12.50 | 10.44 | 4.63 | 4.95 | 4.71 | 4.57 |
| 2020's | 5.09 | 12.69 | 13.39 | 8.61 | 5.80 | 6.73 |
| - = No Data Reported; -- = Not Applicable; NA = Not Available; W = Withheld to avoid disclosure of individual company data. |
| Release Date: 5/29/2026 |
| Next Release Date: 6/30/2026 |