|
Download Data (XLS File) |
|
||||||||
|
||||||||
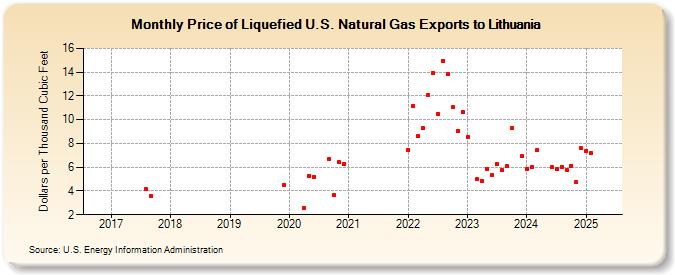
| Price of Liquefied U.S. Natural Gas Exports to Lithuania (Dollars per Thousand Cubic Feet) | ||||||||
| Year | Jan | Feb | Mar | Apr | May | Jun | Jul | Aug | Sep | Oct | Nov | Dec |
|---|---|---|---|---|---|---|---|---|---|---|---|---|
| 2017 | -- | -- | -- | -- | -- | -- | -- | 4.13 | 3.55 | -- | -- | -- |
| 2018 | -- | -- | -- | -- | -- | -- | -- | -- | -- | -- | -- | -- |
| 2019 | -- | -- | -- | -- | -- | -- | -- | -- | -- | -- | -- | 4.50 |
| 2020 | -- | -- | -- | 2.56 | 5.28 | 5.20 | -- | -- | 6.72 | 3.64 | 6.41 | 6.28 |
| 2021 | W | W | W | W | W | W | W | W | ||||
| 2022 | 7.48 | 11.18 | 8.60 | 9.27 | 12.05 | 13.96 | 10.50 | 14.98 | 13.84 | 11.04 | 9.08 | 10.68 |
| 2023 | 8.53 | -- | 4.98 | 4.84 | 5.81 | 5.31 | 6.31 | 5.77 | 6.07 | 9.27 | -- | 6.96 |
| 2024 | 5.85 | 5.98 | 7.42 | -- | -- | 5.98 | 5.87 | 6.04 | 5.78 | 6.13 | 4.73 | 7.58 |
| 2025 | 7.38 | 7.11 | 7.63 | 7.46 | 6.24 | 7.08 | 8.82 | 6.23 | 6.02 | 12.08 | 6.69 | 8.32 |
| 2026 | 8.56 | 11.86 | 9.11 | -- | ||||||||
| - = No Data Reported; -- = Not Applicable; NA = Not Available; W = Withheld to avoid disclosure of individual company data. |
| Release Date: 6/30/2026 |
| Next Release Date: 7/31/2026 |