|
Download Data (XLS File) |
|
||||||||
|
||||||||
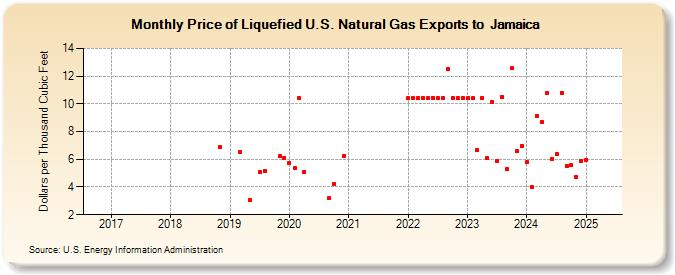
| Price of Liquefied U.S. Natural Gas Exports to Jamaica (Dollars per Thousand Cubic Feet) | ||||||||
| Year | Jan | Feb | Mar | Apr | May | Jun | Jul | Aug | Sep | Oct | Nov | Dec |
|---|---|---|---|---|---|---|---|---|---|---|---|---|
| 2017 | -- | -- | -- | -- | -- | -- | -- | -- | -- | -- | -- | -- |
| 2018 | -- | -- | -- | -- | -- | -- | -- | -- | -- | -- | 6.92 | -- |
| 2019 | -- | -- | 6.52 | -- | 3.07 | -- | 5.05 | 5.15 | -- | -- | 6.22 | 6.08 |
| 2020 | 5.71 | 5.37 | 10.39 | 5.08 | -- | -- | -- | -- | 3.19 | 4.25 | -- | 6.27 |
| 2021 | W | W | W | W | W | W | W | W | W | W | W | |
| 2022 | 10.40 | 10.40 | 10.42 | 10.41 | 10.40 | 10.44 | 10.40 | 10.40 | 12.51 | 10.40 | 10.39 | 10.40 |
| 2023 | 10.39 | 10.39 | 6.65 | 10.44 | 6.06 | 10.14 | 5.86 | 10.52 | 5.27 | 12.56 | 6.57 | 6.98 |
| 2024 | 5.55 | 4.00 | 9.09 | 8.71 | 10.80 | 6.05 | 6.36 | 10.79 | 5.54 | 5.62 | 4.72 | 5.90 |
| 2025 | 5.98 | -- | -- | -- | -- | -- | 7.03 | -- | -- | -- | 6.76 | -- |
| 2026 | 8.51 | 10.82 | 5.87 | 4.12 | ||||||||
| - = No Data Reported; -- = Not Applicable; NA = Not Available; W = Withheld to avoid disclosure of individual company data. |
| Release Date: 6/30/2026 |
| Next Release Date: 7/31/2026 |