|
Download Data (XLS File) |
|
||||||||
|
||||||||
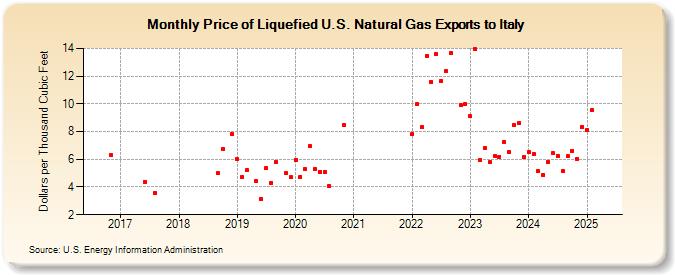
| Price of Liquefied U.S. Natural Gas Exports to Italy (Dollars per Thousand Cubic Feet) | ||||||||
| Year | Jan | Feb | Mar | Apr | May | Jun | Jul | Aug | Sep | Oct | Nov | Dec |
|---|---|---|---|---|---|---|---|---|---|---|---|---|
| 2016 | 6.32 | |||||||||||
| 2017 | -- | -- | -- | -- | -- | 4.38 | -- | 3.55 | -- | -- | -- | -- |
| 2018 | -- | -- | -- | -- | -- | -- | -- | -- | 4.99 | 6.72 | -- | 7.79 |
| 2019 | 6.00 | 4.72 | 5.20 | -- | 4.40 | 3.15 | 5.37 | 4.31 | 5.81 | -- | 4.99 | 4.69 |
| 2020 | 5.98 | 4.75 | 5.29 | 6.93 | 5.27 | 5.10 | 5.08 | 4.07 | -- | -- | 8.49 | -- |
| 2021 | W | W | W | W | W | W | ||||||
| 2022 | 7.83 | 9.96 | 8.32 | 13.47 | 11.60 | 13.59 | 11.65 | 12.34 | 13.70 | -- | 9.89 | 9.96 |
| 2023 | 9.09 | 13.92 | 5.93 | 6.80 | 5.78 | 6.24 | 6.20 | 7.28 | 6.51 | 8.48 | 8.61 | 6.13 |
| 2024 | 6.51 | 6.37 | 5.15 | 4.87 | 5.79 | 6.43 | 6.25 | 5.17 | 6.21 | 6.62 | 6.03 | 8.33 |
| 2025 | 8.10 | 9.53 | 8.79 | 8.35 | 9.34 | 7.62 | 7.04 | 7.09 | 7.36 | 7.63 | 8.07 | 9.47 |
| 2026 | 8.74 | 11.54 | 8.32 | 7.66 | ||||||||
| - = No Data Reported; -- = Not Applicable; NA = Not Available; W = Withheld to avoid disclosure of individual company data. |
| Release Date: 6/30/2026 |
| Next Release Date: 7/31/2026 |