|
Download Data (XLS File) |
|
||||||||
|
||||||||
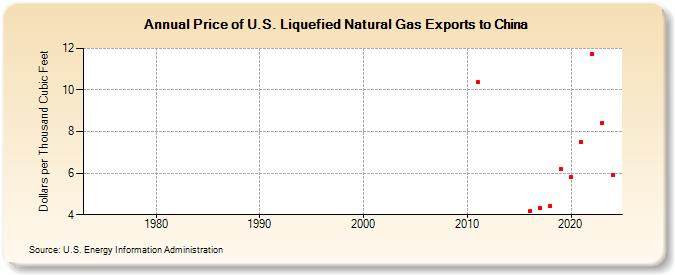
| Price of U.S. Liquefied Natural Gas Exports to China (Dollars per Thousand Cubic Feet) | ||||||||
| Decade | Year-0 | Year-1 | Year-2 | Year-3 | Year-4 | Year-5 | Year-6 | Year-7 | Year-8 | Year-9 |
|---|---|---|---|---|---|---|---|---|---|---|
| 1970's | -- | -- | -- | -- | -- | -- | -- | |||
| 1980's | -- | -- | -- | -- | -- | -- | -- | -- | -- | -- |
| 1990's | -- | -- | -- | -- | -- | -- | -- | -- | -- | -- |
| 2000's | -- | -- | -- | -- | -- | -- | -- | -- | -- | -- |
| 2010's | -- | 10.37 | -- | -- | -- | -- | 4.16 | 4.32 | 4.41 | 6.20 |
| 2020's | 5.82 | 7.49 | 11.74 | 8.42 | 5.91 | 5.84 |
| - = No Data Reported; -- = Not Applicable; NA = Not Available; W = Withheld to avoid disclosure of individual company data. |
| Release Date: 6/30/2026 |
| Next Release Date: 7/31/2026 |