|
Download Data (XLS File) |
|
||||||||
|
||||||||
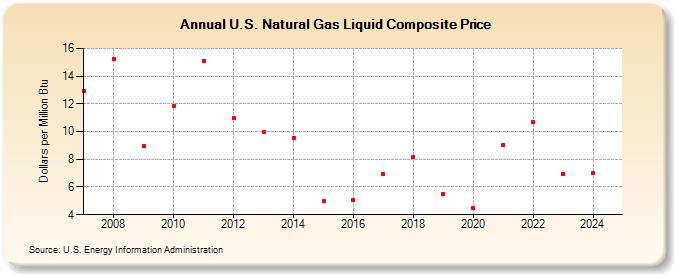
| U.S. Natural Gas Liquid Composite Price (Dollars per Million Btu) | ||||||||
| Decade | Year-0 | Year-1 | Year-2 | Year-3 | Year-4 | Year-5 | Year-6 | Year-7 | Year-8 | Year-9 |
|---|---|---|---|---|---|---|---|---|---|---|
| 2000's | 12.91 | 15.20 | 8.99 | |||||||
| 2010's | 11.83 | 15.12 | 10.98 | 9.94 | 9.56 | 4.97 | 5.04 | 6.92 | 8.20 | 5.49 |
| 2020's | 4.47 | 9.02 | 10.71 | 6.92 | 6.98 | 6.75 |
| - = No Data Reported; -- = Not Applicable; NA = Not Available; W = Withheld to avoid disclosure of individual company data. |
| Release Date: 6/30/2026 |
| Next Release Date: 7/31/2026 |
Referring Pages: