|
Download Data (XLS File) |
|
|||||
|
|||||
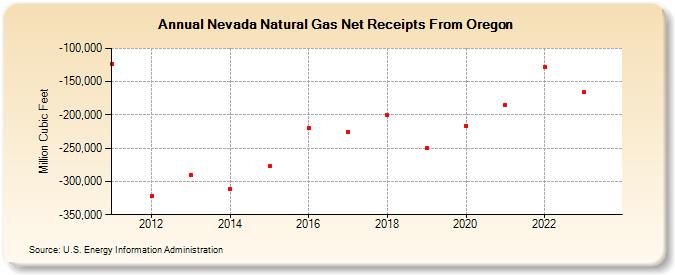
| Nevada Natural Gas Net Receipts From Oregon (Million Cubic Feet) | |||||
| Decade | Year-0 | Year-1 | Year-2 | Year-3 | Year-4 | Year-5 | Year-6 | Year-7 | Year-8 | Year-9 |
|---|---|---|---|---|---|---|---|---|---|---|
| 2010's | -122,960 | -322,448 | -290,859 | -311,601 | -277,368 | -220,307 | -225,106 | -200,795 | -250,118 | |
| 2020's | -216,222 | -184,400 | -128,690 | -165,737 | -122,360 |
| - = No Data Reported; -- = Not Applicable; NA = Not Available; W = Withheld to avoid disclosure of individual company data. |
| Release Date: 6/30/2026 |
| Next Release Date: 7/31/2026 |