|
Download Data (XLS File) |
|
|||||
|
|||||
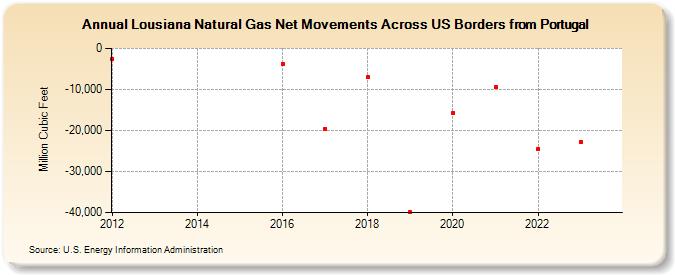
| Lousiana Natural Gas Net Movements Across US Borders from Portugal (Million Cubic Feet) | |||||
| Decade | Year-0 | Year-1 | Year-2 | Year-3 | Year-4 | Year-5 | Year-6 | Year-7 | Year-8 | Year-9 |
|---|---|---|---|---|---|---|---|---|---|---|
| 2010's | -2,618 | -3,700 | -19,523 | -6,918 | -39,908 | |||||
| 2020's | -15,710 | -9,447 | -24,439 | -22,806 | -19,633 |
| - = No Data Reported; -- = Not Applicable; NA = Not Available; W = Withheld to avoid disclosure of individual company data. |
| Release Date: 6/30/2026 |
| Next Release Date: 7/31/2026 |