|
Download Data (XLS File) |
|
||||||||
|
||||||||
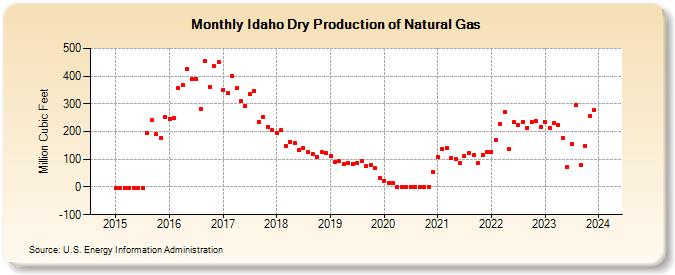
| Idaho Dry Production of Natural Gas (Million Cubic Feet) | ||||||||
| Year | Jan | Feb | Mar | Apr | May | Jun | Jul | Aug | Sep | Oct | Nov | Dec |
|---|---|---|---|---|---|---|---|---|---|---|---|---|
| 2015 | -3 | -3 | -3 | -3 | -4 | -4 | -4 | 196 | 241 | 190 | 175 | 253 |
| 2016 | 244 | 248 | 356 | 367 | 427 | 389 | 390 | 280 | 454 | 360 | 435 | 450 |
| 2017 | 351 | 338 | 402 | 358 | 310 | 292 | 335 | 348 | 236 | 252 | 217 | 204 |
| 2018 | 196 | 205 | 147 | 163 | 158 | 133 | 139 | 127 | 119 | 110 | 127 | 122 |
| 2019 | 112 | 91 | 93 | 82 | 87 | 83 | 88 | 94 | 74 | 79 | 68 | 34 |
| 2020 | 23 | 16 | 15 | 0 | 0 | 0 | 0 | 0 | 0 | 0 | 0 | 53 |
| 2021 | 109 | 136 | 140 | 104 | 101 | 85 | 113 | 123 | 115 | 87 | 116 | 127 |
| 2022 | 128 | 169 | 227 | 272 | 136 | 233 | 223 | 236 | 213 | 235 | 238 | 217 |
| 2023 | 236 | 212 | 230 | 223 | 177 | 73 | 155 | 294 | 78 | 148 | 255 | 276 |
| 2024 | 291 | 164 | -2 | -2 | 22 | 36 | 89 | 63 | 72 | 92 | 117 | 181 |
| - = No Data Reported; -- = Not Applicable; NA = Not Available; W = Withheld to avoid disclosure of individual company data. |
| Release Date: 6/30/2026 |
| Next Release Date: 7/31/2026 |