|
Download Data (XLS File) |
|
|||||
|
|||||
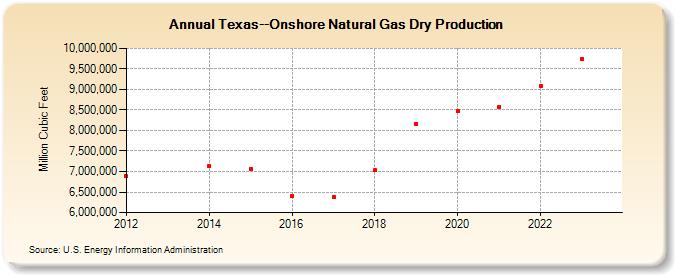
| Texas--Onshore Natural Gas Dry Production (Million Cubic Feet) | |||||
| Decade | Year-0 | Year-1 | Year-2 | Year-3 | Year-4 | Year-5 | Year-6 | Year-7 | Year-8 | Year-9 |
|---|---|---|---|---|---|---|---|---|---|---|
| 2010's | 6,878,956 | 7,135,326 | 7,062,316 | 6,398,909 | 6,378,262 | 7,025,786 | 8,167,509 | |||
| 2020's | 8,473,796 | 8,575,278 | 9,076,949 | 9,627,016 | 10,053,207 |
| - = No Data Reported; -- = Not Applicable; NA = Not Available; W = Withheld to avoid disclosure of individual company data. |
| Release Date: 6/30/2026 |
| Next Release Date: 7/31/2026 |