|
Download Data (XLS File) |
|
|||||
|
|||||
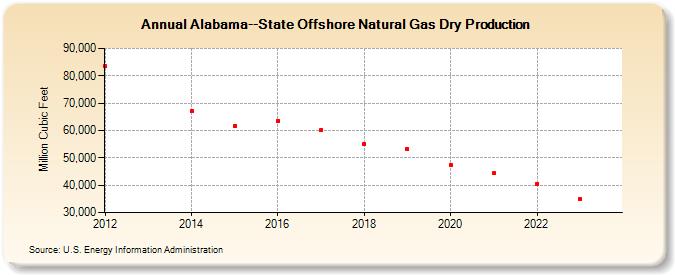
| Alabama--State Offshore Natural Gas Dry Production (Million Cubic Feet) | |||||
| Decade | Year-0 | Year-1 | Year-2 | Year-3 | Year-4 | Year-5 | Year-6 | Year-7 | Year-8 | Year-9 |
|---|---|---|---|---|---|---|---|---|---|---|
| 2010's | 83,420 | 67,106 | 61,773 | 63,584 | 60,118 | 55,144 | 53,203 | |||
| 2020's | 47,301 | 44,307 | 40,536 | 35,497 | 29,764 |
| - = No Data Reported; -- = Not Applicable; NA = Not Available; W = Withheld to avoid disclosure of individual company data. |
| Release Date: 7/31/2026 |
| Next Release Date: 8/31/2026 |