|
Download Data (XLS File) |
|
|||||
|
|||||
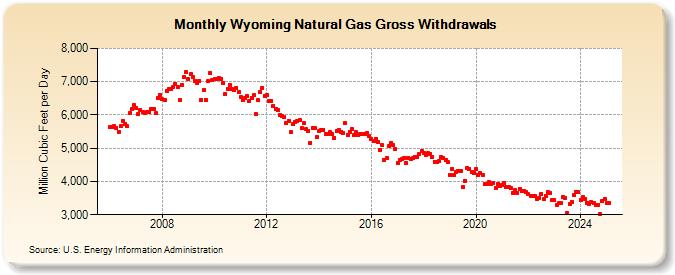
| Wyoming Natural Gas Gross Withdrawals (Million Cubic Feet per Day) | |||||
| Year | Jan | Feb | Mar | Apr | May | Jun | Jul | Aug | Sep | Oct | Nov | Dec |
|---|---|---|---|---|---|---|---|---|---|---|---|---|
| 2006 | 5,624 | 5,636 | 5,666 | 5,613 | 5,495 | 5,656 | 5,823 | 5,730 | 5,658 | 6,063 | 6,164 | 6,284 |
| 2007 | 6,196 | 6,040 | 6,149 | 6,093 | 6,046 | 6,085 | 6,094 | 6,179 | 6,176 | 6,047 | 6,512 | 6,604 |
| 2008 | 6,469 | 6,436 | 6,722 | 6,767 | 6,771 | 6,839 | 6,940 | 6,835 | 6,447 | 6,909 | 7,126 | 7,297 |
| 2009 | 7,067 | 7,220 | 7,135 | 7,028 | 6,957 | 7,030 | 6,446 | 6,746 | 6,461 | 7,010 | 7,256 | 7,057 |
| 2010 | 7,074 | 7,092 | 7,110 | 7,087 | 6,950 | 6,643 | 6,784 | 6,909 | 6,786 | 6,746 | 6,821 | 6,685 |
| 2011 | 6,540 | 6,435 | 6,504 | 6,557 | 6,424 | 6,516 | 6,586 | 6,019 | 6,440 | 6,674 | 6,822 | 6,578 |
| 2012 | 6,607 | 6,410 | 6,424 | 6,282 | 6,190 | 6,136 | 6,011 | 5,960 | 5,924 | 5,743 | 5,828 | 5,473 |
| 2013 | 5,715 | 5,801 | 5,816 | 5,846 | 5,596 | 5,746 | 5,565 | 5,529 | 5,168 | 5,613 | 5,600 | 5,343 |
| 2014 | 5,523 | 5,534 | 5,556 | 5,424 | 5,434 | 5,472 | 5,438 | 5,316 | 5,510 | 5,541 | 5,491 | 5,470 |
| 2015 | 5,744 | 5,397 | 5,500 | 5,576 | 5,397 | 5,472 | 5,401 | 5,420 | 5,440 | 5,441 | 5,463 | 5,364 |
| 2016 | 5,271 | 5,209 | 5,291 | 5,190 | 4,953 | 5,085 | 4,641 | 4,695 | 5,062 | 5,164 | 5,090 | 4,977 |
| 2017 | 4,556 | 4,644 | 4,668 | 4,705 | 4,558 | 4,710 | 4,661 | 4,691 | 4,734 | 4,741 | 4,835 | 4,907 |
| 2018 | 4,860 | 4,809 | 4,854 | 4,839 | 4,743 | 4,599 | 4,586 | 4,609 | 4,747 | 4,707 | 4,654 | 4,577 |
| 2019 | 4,204 | 4,378 | 4,205 | 4,290 | 4,312 | 4,323 | 3,831 | 4,025 | 4,412 | 4,383 | 4,292 | 4,247 |
| 2020 | 4,380 | 4,197 | 4,252 | 4,191 | 3,921 | 3,919 | 3,978 | 3,917 | 3,939 | 3,816 | 3,933 | 3,857 |
| 2021 | 3,905 | 3,947 | 3,825 | 3,820 | 3,793 | 3,658 | 3,735 | 3,667 | 3,777 | 3,710 | 3,727 | 3,672 |
| 2022 | 3,608 | 3,571 | 3,553 | 3,565 | 3,484 | 3,495 | 3,630 | 3,468 | 3,563 | 3,668 | 3,645 | 3,446 |
| 2023 | 3,607 | 3,429 | 3,478 | 3,487 | 3,682 | 3,672 | 3,201 | 3,489 | 3,552 | 3,770 | 3,850 | 3,844 |
| 2024 | 3,765 | 3,836 | 3,768 | 3,650 | 3,634 | 3,684 | 3,657 | 3,591 | 3,608 | 3,356 | 3,729 | 3,774 |
| 2025 | 3,362 | 3,356 | 3,367 | 3,372 | 3,253 | 3,296 | 3,220 | 3,050 | 3,142 | 3,276 | 3,314 | 3,372 |
| 2026 | 3,331 | 3,324 | 3,240 | 3,089 | ||||||||
| - = No Data Reported; -- = Not Applicable; NA = Not Available; W = Withheld to avoid disclosure of individual company data. |
| Release Date: 6/30/2026 |
| Next Release Date: 7/31/2026 |