|
Download Data (XLS File) |
|
|||||
|
|||||
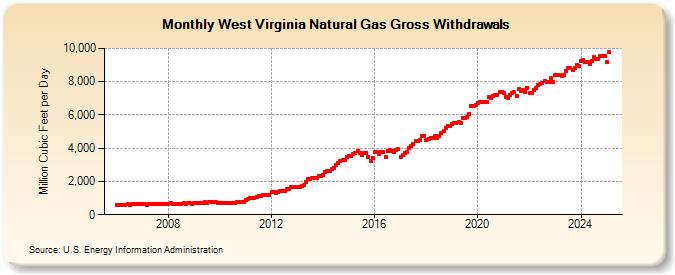
| West Virginia Natural Gas Gross Withdrawals (Million Cubic Feet per Day) | |||||
| Year | Jan | Feb | Mar | Apr | May | Jun | Jul | Aug | Sep | Oct | Nov | Dec |
|---|---|---|---|---|---|---|---|---|---|---|---|---|
| 2006 | 588 | 611 | 599 | 584 | 608 | 616 | 606 | 654 | 628 | 622 | 645 | 652 |
| 2007 | 617 | 615 | 609 | 619 | 626 | 631 | 635 | 629 | 662 | 628 | 673 | 657 |
| 2008 | 662 | 676 | 663 | 662 | 658 | 670 | 674 | 678 | 657 | 692 | 681 | 657 |
| 2009 | 679 | 695 | 712 | 724 | 731 | 735 | 733 | 741 | 751 | 743 | 742 | 706 |
| 2010 | 702 | 711 | 708 | 714 | 717 | 727 | 729 | 730 | 738 | 751 | 754 | 737 |
| 2011 | 884 | 935 | 976 | 1,016 | 1,030 | 1,078 | 1,135 | 1,118 | 1,211 | 1,180 | 1,171 | 1,214 |
| 2012 | 1,337 | 1,355 | 1,320 | 1,348 | 1,431 | 1,430 | 1,418 | 1,523 | 1,537 | 1,654 | 1,682 | 1,659 |
| 2013 | 1,643 | 1,641 | 1,712 | 1,800 | 1,968 | 2,125 | 2,151 | 2,227 | 2,216 | 2,191 | 2,355 | 2,334 |
| 2014 | 2,384 | 2,559 | 2,648 | 2,641 | 2,720 | 2,787 | 2,987 | 3,083 | 3,229 | 3,276 | 3,267 | 3,474 |
| 2015 | 3,557 | 3,539 | 3,673 | 3,711 | 3,822 | 3,730 | 3,600 | 3,701 | 3,723 | 3,495 | 3,249 | 3,436 |
| 2016 | 3,772 | 3,778 | 3,668 | 3,749 | 3,743 | 3,489 | 3,840 | 3,904 | 3,849 | 3,776 | 3,895 | 3,925 |
| 2017 | 3,468 | 3,572 | 3,713 | 3,776 | 4,001 | 4,157 | 4,271 | 4,421 | 4,436 | 4,485 | 4,719 | 4,727 |
| 2018 | 4,486 | 4,573 | 4,605 | 4,630 | 4,704 | 4,620 | 4,749 | 4,894 | 5,035 | 5,231 | 5,342 | 5,360 |
| 2019 | 5,453 | 5,533 | 5,533 | 5,594 | 5,526 | 5,826 | 5,823 | 5,869 | 6,044 | 6,510 | 6,535 | 6,586 |
| 2020 | 6,729 | 6,789 | 6,747 | 6,756 | 6,803 | 7,050 | 7,041 | 7,124 | 7,218 | 7,213 | 7,350 | 7,371 |
| 2021 | 7,302 | 7,086 | 7,018 | 7,175 | 7,298 | 7,358 | 7,152 | 7,579 | 7,468 | 7,475 | 7,383 | 7,635 |
| 2022 | 7,313 | 7,289 | 7,512 | 7,626 | 7,824 | 7,839 | 7,942 | 8,022 | 7,988 | 7,960 | 8,219 | 7,970 |
| 2023 | 8,365 | 8,389 | 8,339 | 8,298 | 8,351 | 8,614 | 8,813 | 8,810 | 8,718 | 8,761 | 8,925 | 8,836 |
| 2024 | 9,269 | 9,278 | 9,178 | 9,208 | 9,064 | 9,266 | 9,466 | 9,354 | 9,381 | 9,517 | 9,530 | 9,551 |
| 2025 | 9,158 | 9,765 | 9,671 | 9,862 | 9,905 | 10,047 | 9,974 | 9,969 | 10,061 | 9,977 | 10,067 | 9,909 |
| 2026 | 9,652 | 9,741 | 9,954 | 9,892 | ||||||||
| - = No Data Reported; -- = Not Applicable; NA = Not Available; W = Withheld to avoid disclosure of individual company data. |
| Release Date: 6/30/2026 |
| Next Release Date: 7/31/2026 |