|
Download Data (XLS File) |
|
|||||
|
|||||
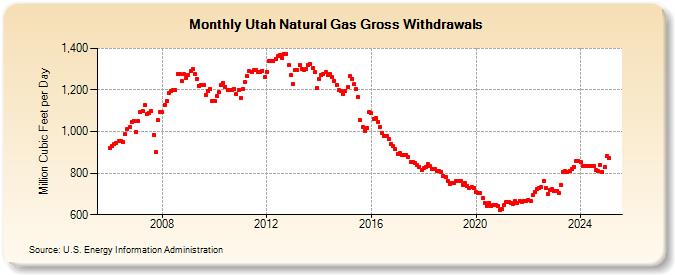
| Utah Natural Gas Gross Withdrawals (Million Cubic Feet per Day) | |||||
| Year | Jan | Feb | Mar | Apr | May | Jun | Jul | Aug | Sep | Oct | Nov | Dec |
|---|---|---|---|---|---|---|---|---|---|---|---|---|
| 2006 | 919 | 931 | 941 | 945 | 953 | 956 | 948 | 987 | 1,010 | 1,023 | 1,046 | 1,053 |
| 2007 | 997 | 1,050 | 1,093 | 1,098 | 1,126 | 1,083 | 1,091 | 1,098 | 984 | 900 | 1,057 | 1,092 |
| 2008 | 1,092 | 1,130 | 1,148 | 1,185 | 1,196 | 1,198 | 1,200 | 1,277 | 1,276 | 1,241 | 1,275 | 1,259 |
| 2009 | 1,273 | 1,289 | 1,300 | 1,278 | 1,254 | 1,218 | 1,224 | 1,222 | 1,178 | 1,195 | 1,203 | 1,148 |
| 2010 | 1,146 | 1,169 | 1,188 | 1,223 | 1,234 | 1,216 | 1,198 | 1,200 | 1,200 | 1,207 | 1,179 | 1,201 |
| 2011 | 1,162 | 1,205 | 1,237 | 1,269 | 1,290 | 1,287 | 1,294 | 1,298 | 1,286 | 1,287 | 1,293 | 1,262 |
| 2012 | 1,288 | 1,338 | 1,341 | 1,339 | 1,348 | 1,363 | 1,370 | 1,353 | 1,375 | 1,375 | 1,318 | 1,271 |
| 2013 | 1,228 | 1,295 | 1,297 | 1,320 | 1,301 | 1,295 | 1,299 | 1,320 | 1,324 | 1,307 | 1,285 | 1,211 |
| 2014 | 1,253 | 1,270 | 1,277 | 1,286 | 1,274 | 1,276 | 1,260 | 1,245 | 1,225 | 1,201 | 1,196 | 1,183 |
| 2015 | 1,196 | 1,213 | 1,265 | 1,254 | 1,227 | 1,207 | 1,166 | 1,054 | 1,022 | 1,005 | 1,016 | 1,092 |
| 2016 | 1,087 | 1,061 | 1,063 | 1,048 | 1,022 | 991 | 980 | 978 | 963 | 942 | 929 | 914 |
| 2017 | 894 | 895 | 888 | 888 | 889 | 877 | 854 | 852 | 847 | 837 | 831 | 814 |
| 2018 | 824 | 830 | 844 | 834 | 819 | 820 | 811 | 808 | 807 | 786 | 781 | 762 |
| 2019 | 748 | 752 | 754 | 760 | 762 | 764 | 745 | 754 | 738 | 729 | 731 | 729 |
| 2020 | 709 | 704 | 704 | 680 | 657 | 643 | 657 | 642 | 645 | 647 | 641 | 625 |
| 2021 | 627 | 648 | 659 | 661 | 657 | 652 | 666 | 658 | 666 | 662 | 668 | 665 |
| 2022 | 672 | 666 | 696 | 711 | 722 | 728 | 733 | 762 | 730 | 699 | 720 | 723 |
| 2023 | 719 | 716 | 707 | 749 | 804 | 808 | 805 | 812 | 820 | 833 | 877 | 873 |
| 2024 | 870 | 856 | 848 | 835 | 819 | 835 | 833 | 817 | 822 | 845 | 821 | 842 |
| 2025 | 881 | 903 | 915 | 935 | 943 | 939 | 945 | 936 | 956 | 939 | 917 | 923 |
| 2026 | 954 | 968 | 954 | 952 | ||||||||
| - = No Data Reported; -- = Not Applicable; NA = Not Available; W = Withheld to avoid disclosure of individual company data. |
| Release Date: 6/30/2026 |
| Next Release Date: 7/31/2026 |