|
Download Data (XLS File) |
|
|||||
|
|||||
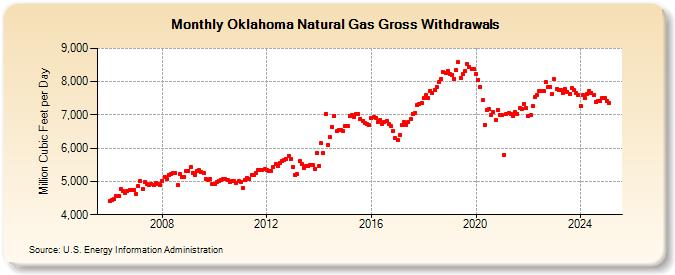
| Oklahoma Natural Gas Gross Withdrawals (Million Cubic Feet per Day) | |||||
| Year | Jan | Feb | Mar | Apr | May | Jun | Jul | Aug | Sep | Oct | Nov | Dec |
|---|---|---|---|---|---|---|---|---|---|---|---|---|
| 2006 | 4,412 | 4,442 | 4,472 | 4,563 | 4,567 | 4,760 | 4,700 | 4,664 | 4,722 | 4,747 | 4,732 | 4,739 |
| 2007 | 4,634 | 4,850 | 5,019 | 4,778 | 4,979 | 4,916 | 4,902 | 4,924 | 4,892 | 4,945 | 4,909 | 4,888 |
| 2008 | 5,018 | 5,144 | 5,074 | 5,208 | 5,215 | 5,241 | 5,256 | 4,896 | 5,224 | 5,126 | 5,145 | 5,318 |
| 2009 | 5,322 | 5,433 | 5,262 | 5,207 | 5,325 | 5,331 | 5,293 | 5,241 | 5,076 | 5,055 | 5,067 | 4,923 |
| 2010 | 4,915 | 4,976 | 5,005 | 5,057 | 5,063 | 5,067 | 5,032 | 4,984 | 5,004 | 5,011 | 4,959 | 5,001 |
| 2011 | 4,998 | 4,812 | 5,036 | 5,110 | 5,087 | 5,197 | 5,186 | 5,247 | 5,340 | 5,335 | 5,355 | 5,372 |
| 2012 | 5,358 | 5,315 | 5,305 | 5,431 | 5,529 | 5,474 | 5,540 | 5,619 | 5,637 | 5,674 | 5,776 | 5,679 |
| 2013 | 5,436 | 5,193 | 5,213 | 5,607 | 5,527 | 5,411 | 5,455 | 5,467 | 5,484 | 5,489 | 5,386 | 5,856 |
| 2014 | 5,469 | 6,146 | 5,845 | 7,028 | 6,098 | 6,328 | 6,636 | 6,981 | 6,505 | 6,547 | 6,554 | 6,506 |
| 2015 | 6,672 | 6,669 | 6,970 | 6,999 | 6,924 | 7,036 | 7,028 | 6,888 | 6,810 | 6,753 | 6,717 | 6,700 |
| 2016 | 6,903 | 6,940 | 6,921 | 6,784 | 6,833 | 6,736 | 6,794 | 6,813 | 6,740 | 6,652 | 6,512 | 6,304 |
| 2017 | 6,256 | 6,399 | 6,710 | 6,779 | 6,706 | 6,790 | 6,871 | 7,040 | 7,055 | 7,304 | 7,334 | 7,372 |
| 2018 | 7,507 | 7,592 | 7,515 | 7,721 | 7,657 | 7,748 | 7,845 | 7,977 | 8,092 | 8,288 | 8,270 | 8,317 |
| 2019 | 8,226 | 8,202 | 8,094 | 8,344 | 8,581 | 8,111 | 8,216 | 8,306 | 8,536 | 8,434 | 8,372 | 8,384 |
| 2020 | 8,240 | 8,056 | 7,836 | 7,434 | 6,712 | 7,154 | 7,173 | 6,992 | 7,085 | 6,836 | 7,157 | 7,009 |
| 2021 | 6,986 | 5,799 | 7,018 | 7,065 | 7,037 | 6,967 | 7,094 | 7,038 | 7,205 | 7,165 | 7,336 | 7,208 |
| 2022 | 6,957 | 6,986 | 7,260 | 7,536 | 7,595 | 7,721 | 7,722 | 7,718 | 7,983 | 7,850 | 7,852 | 7,631 |
| 2023 | 8,056 | 7,638 | 7,645 | 7,623 | 7,605 | 7,417 | 7,485 | 7,373 | 7,545 | 7,456 | 7,356 | 7,521 |
| 2024 | 7,282 | 7,585 | 7,496 | 7,614 | 7,714 | 7,670 | 7,596 | 7,392 | 7,404 | 7,423 | 7,508 | 7,508 |
| 2025 | 7,431 | 7,361 | 7,741 | 7,785 | 8,009 | 7,997 | 8,046 | 7,957 | 7,988 | 7,969 | 8,031 | 8,252 |
| 2026 | 7,884 | 8,037 | 8,046 | 8,084 | ||||||||
| - = No Data Reported; -- = Not Applicable; NA = Not Available; W = Withheld to avoid disclosure of individual company data. |
| Release Date: 6/30/2026 |
| Next Release Date: 7/31/2026 |