|
Download Data (XLS File) |
|
|||||
|
|||||
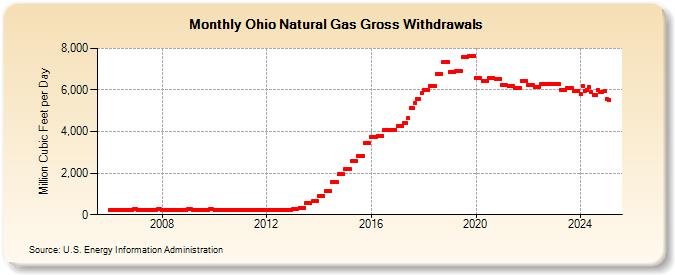
| Ohio Natural Gas Gross Withdrawals (Million Cubic Feet per Day) | |||||
| Year | Jan | Feb | Mar | Apr | May | Jun | Jul | Aug | Sep | Oct | Nov | Dec |
|---|---|---|---|---|---|---|---|---|---|---|---|---|
| 2006 | 247 | 244 | 238 | 236 | 230 | 228 | 224 | 224 | 228 | 240 | 249 | 252 |
| 2007 | 252 | 249 | 243 | 240 | 234 | 232 | 228 | 228 | 233 | 245 | 254 | 257 |
| 2008 | 243 | 232 | 234 | 232 | 226 | 224 | 220 | 220 | 224 | 236 | 245 | 248 |
| 2009 | 254 | 251 | 245 | 242 | 236 | 234 | 230 | 230 | 235 | 247 | 256 | 259 |
| 2010 | 223 | 221 | 215 | 213 | 208 | 206 | 203 | 203 | 206 | 217 | 225 | 228 |
| 2011 | 226 | 223 | 217 | 215 | 210 | 208 | 204 | 204 | 208 | 220 | 227 | 230 |
| 2012 | 231 | 231 | 231 | 231 | 231 | 231 | 231 | 231 | 231 | 231 | 231 | 231 |
| 2013 | 273 | 273 | 273 | 346 | 346 | 346 | 546 | 546 | 546 | 649 | 649 | 649 |
| 2014 | 911 | 911 | 911 | 1,138 | 1,138 | 1,138 | 1,595 | 1,595 | 1,595 | 1,957 | 1,957 | 1,957 |
| 2015 | 2,183 | 2,183 | 2,183 | 2,580 | 2,580 | 2,580 | 2,832 | 2,832 | 2,832 | 3,428 | 3,428 | 3,428 |
| 2016 | 3,751 | 3,751 | 3,751 | 3,810 | 3,810 | 3,810 | 4,059 | 4,059 | 4,059 | 4,084 | 4,084 | 4,084 |
| 2017 | 4,253 | 4,253 | 4,253 | 4,403 | 4,403 | 4,642 | 5,130 | 5,130 | 5,359 | 5,589 | 5,589 | 5,839 |
| 2018 | 6,018 | 6,018 | 6,018 | 6,206 | 6,206 | 6,206 | 6,771 | 6,771 | 6,771 | 7,327 | 7,327 | 7,327 |
| 2019 | 6,880 | 6,880 | 6,880 | 6,933 | 6,933 | 6,933 | 7,596 | 7,596 | 7,596 | 7,638 | 7,638 | 7,638 |
| 2020 | 6,564 | 6,564 | 6,564 | 6,429 | 6,429 | 6,429 | 6,571 | 6,571 | 6,571 | 6,551 | 6,551 | 6,551 |
| 2021 | 6,226 | 6,226 | 6,226 | 6,178 | 6,178 | 6,178 | 6,117 | 6,117 | 6,117 | 6,450 | 6,450 | 6,450 |
| 2022 | 6,220 | 6,220 | 6,220 | 6,130 | 6,130 | 6,130 | 6,300 | 6,300 | 6,300 | 6,280 | 6,280 | 6,280 |
| 2023 | 6,286 | 6,286 | 6,286 | 6,036 | 6,036 | 6,036 | 6,097 | 6,097 | 6,097 | 5,985 | 5,985 | 5,985 |
| 2024 | 5,952 | 5,952 | 5,952 | 5,869 | 5,869 | 5,869 | 5,833 | 5,833 | 5,833 | 5,908 | 5,908 | 5,908 |
| 2025 | 5,554 | 5,530 | 5,506 | 5,354 | 5,547 | 5,684 | 5,773 | 5,975 | 6,028 | 6,093 | 6,070 | 5,933 |
| 2026 | 5,738 | 5,787 | 5,798 | 5,918 | ||||||||
| - = No Data Reported; -- = Not Applicable; NA = Not Available; W = Withheld to avoid disclosure of individual company data. |
| Release Date: 6/30/2026 |
| Next Release Date: 7/31/2026 |