|
Download Data (XLS File) |
|
|||||
|
|||||
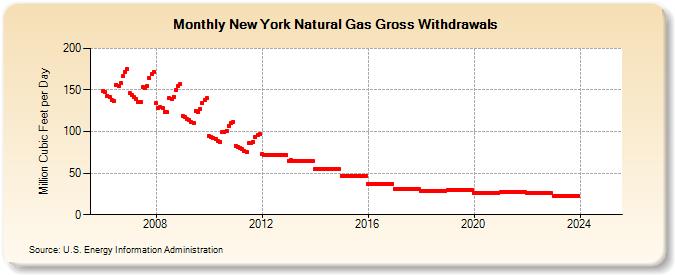
| New York Natural Gas Gross Withdrawals (Million Cubic Feet per Day) | |||||
| Year | Jan | Feb | Mar | Apr | May | Jun | Jul | Aug | Sep | Oct | Nov | Dec |
|---|---|---|---|---|---|---|---|---|---|---|---|---|
| 2006 | 149 | 147 | 143 | 142 | 138 | 137 | 156 | 155 | 158 | 167 | 172 | 175 |
| 2007 | 146 | 144 | 141 | 139 | 136 | 135 | 153 | 152 | 155 | 164 | 169 | 172 |
| 2008 | 134 | 128 | 129 | 128 | 124 | 123 | 140 | 139 | 142 | 150 | 155 | 157 |
| 2009 | 119 | 118 | 115 | 114 | 111 | 110 | 125 | 124 | 127 | 134 | 138 | 140 |
| 2010 | 95 | 94 | 92 | 91 | 89 | 88 | 99 | 99 | 101 | 107 | 110 | 112 |
| 2011 | 83 | 82 | 80 | 79 | 77 | 76 | 86 | 86 | 88 | 93 | 96 | 97 |
| 2012 | 73 | 72 | 72 | 72 | 72 | 72 | 72 | 72 | 72 | 72 | 72 | 72 |
| 2013 | 65 | 66 | 64 | 64 | 64 | 64 | 64 | 64 | 64 | 64 | 64 | 64 |
| 2014 | 55 | 55 | 55 | 55 | 55 | 55 | 55 | 55 | 55 | 55 | 55 | 55 |
| 2015 | 47 | 47 | 47 | 47 | 47 | 47 | 47 | 47 | 47 | 47 | 47 | 47 |
| 2016 | 37 | 37 | 37 | 37 | 37 | 37 | 37 | 37 | 37 | 37 | 37 | 37 |
| 2017 | 31 | 31 | 31 | 31 | 31 | 31 | 31 | 31 | 31 | 31 | 31 | 31 |
| 2018 | 29 | 29 | 29 | 29 | 29 | 29 | 29 | 29 | 29 | 29 | 29 | 29 |
| 2019 | 30 | 30 | 30 | 30 | 30 | 30 | 30 | 30 | 30 | 30 | 30 | 30 |
| 2020 | 26 | 26 | 26 | 26 | 26 | 26 | 26 | 26 | 26 | 26 | 26 | 26 |
| 2021 | 27 | 27 | 27 | 27 | 27 | 27 | 27 | 27 | 27 | 27 | 27 | 27 |
| 2022 | 26 | 26 | 26 | 26 | 26 | 26 | 26 | 26 | 26 | 26 | 26 | 26 |
| 2023 | 23 | 23 | 23 | 23 | 23 | 23 | 23 | 23 | 23 | 23 | 23 | 23 |
| 2024 | 24 | 24 | 24 | 24 | 24 | 24 | 24 | 24 | 24 | 24 | 24 | 24 |
| 2025 | NA | NA | NA | NA | NA | NA | NA | NA | NA | NA | NA | NA |
| 2026 | NA | NA | NA | NA | ||||||||
| - = No Data Reported; -- = Not Applicable; NA = Not Available; W = Withheld to avoid disclosure of individual company data. |
| Release Date: 6/30/2026 |
| Next Release Date: 7/31/2026 |