|
Download Data (XLS File) |
|
|||||
|
|||||
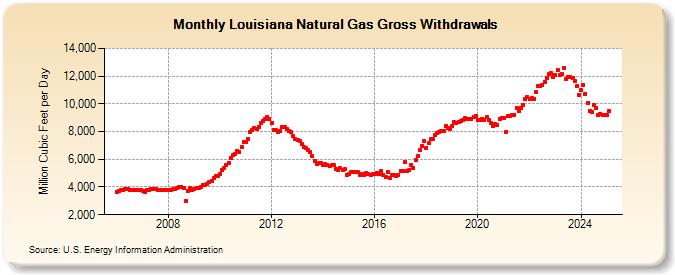
| Louisiana Natural Gas Gross Withdrawals (Million Cubic Feet per Day) | |||||
| Year | Jan | Feb | Mar | Apr | May | Jun | Jul | Aug | Sep | Oct | Nov | Dec |
|---|---|---|---|---|---|---|---|---|---|---|---|---|
| 2006 | 3,649 | 3,687 | 3,775 | 3,772 | 3,822 | 3,858 | 3,789 | 3,785 | 3,810 | 3,799 | 3,786 | 3,776 |
| 2007 | 3,718 | 3,672 | 3,750 | 3,794 | 3,866 | 3,875 | 3,869 | 3,759 | 3,784 | 3,789 | 3,785 | 3,793 |
| 2008 | 3,797 | 3,791 | 3,820 | 3,852 | 3,934 | 3,989 | 4,008 | 3,896 | 2,960 | 3,718 | 3,916 | 3,802 |
| 2009 | 3,829 | 3,925 | 3,941 | 4,034 | 4,119 | 4,134 | 4,220 | 4,382 | 4,448 | 4,616 | 4,801 | 4,772 |
| 2010 | 4,930 | 5,193 | 5,385 | 5,585 | 5,738 | 6,067 | 6,281 | 6,415 | 6,622 | 6,542 | 6,867 | 7,248 |
| 2011 | 7,273 | 7,480 | 7,978 | 8,115 | 8,278 | 8,163 | 8,344 | 8,637 | 8,797 | 8,877 | 9,055 | 8,908 |
| 2012 | 8,581 | 8,140 | 8,102 | 7,994 | 8,068 | 8,309 | 8,364 | 8,210 | 8,075 | 7,961 | 7,644 | 7,447 |
| 2013 | 7,407 | 7,324 | 7,080 | 6,896 | 6,810 | 6,663 | 6,495 | 6,208 | 5,903 | 5,672 | 5,697 | 5,718 |
| 2014 | 5,620 | 5,623 | 5,597 | 5,502 | 5,554 | 5,559 | 5,327 | 5,210 | 5,349 | 5,237 | 5,268 | 4,900 |
| 2015 | 4,953 | 5,060 | 5,077 | 5,114 | 5,065 | 4,863 | 4,910 | 4,893 | 5,004 | 4,903 | 4,869 | 4,910 |
| 2016 | 4,971 | 5,035 | 4,954 | 5,145 | 4,892 | 4,693 | 5,069 | 4,679 | 4,858 | 4,881 | 4,767 | 4,860 |
| 2017 | 5,174 | 5,144 | 5,782 | 5,154 | 5,238 | 5,569 | 5,379 | 5,917 | 6,228 | 6,694 | 6,985 | 7,318 |
| 2018 | 6,823 | 7,157 | 7,432 | 7,430 | 7,723 | 7,915 | 7,941 | 8,038 | 8,040 | 8,384 | 8,267 | 8,173 |
| 2019 | 8,384 | 8,663 | 8,621 | 8,677 | 8,731 | 8,862 | 8,968 | 8,933 | 8,906 | 8,905 | 9,040 | 9,131 |
| 2020 | 8,849 | 8,851 | 8,924 | 8,834 | 9,067 | 8,818 | 8,609 | 8,408 | 8,536 | 8,490 | 8,934 | 8,980 |
| 2021 | 8,961 | 7,985 | 9,140 | 9,134 | 9,161 | 9,219 | 9,689 | 9,458 | 9,699 | 9,941 | 10,362 | 10,505 |
| 2022 | 10,320 | 10,425 | 10,359 | 10,846 | 11,264 | 11,297 | 11,359 | 11,607 | 11,867 | 12,122 | 12,218 | 11,968 |
| 2023 | 12,075 | 12,471 | 12,069 | 12,156 | 12,554 | 11,771 | 11,923 | 11,969 | 11,883 | 11,727 | 11,549 | 11,101 |
| 2024 | 10,970 | 11,376 | 10,734 | 10,047 | 9,505 | 9,445 | 9,908 | 9,716 | 9,214 | 9,295 | 9,219 | 9,217 |
| 2025 | 9,204 | 9,446 | 11,024 | 10,605 | 10,842 | 10,024 | 10,447 | 10,833 | 10,380 | 10,333 | 11,099 | 11,172 |
| 2026 | 10,586 | 11,129 | 11,416 | 11,758 | ||||||||
| - = No Data Reported; -- = Not Applicable; NA = Not Available; W = Withheld to avoid disclosure of individual company data. |
| Release Date: 6/30/2026 |
| Next Release Date: 7/31/2026 |